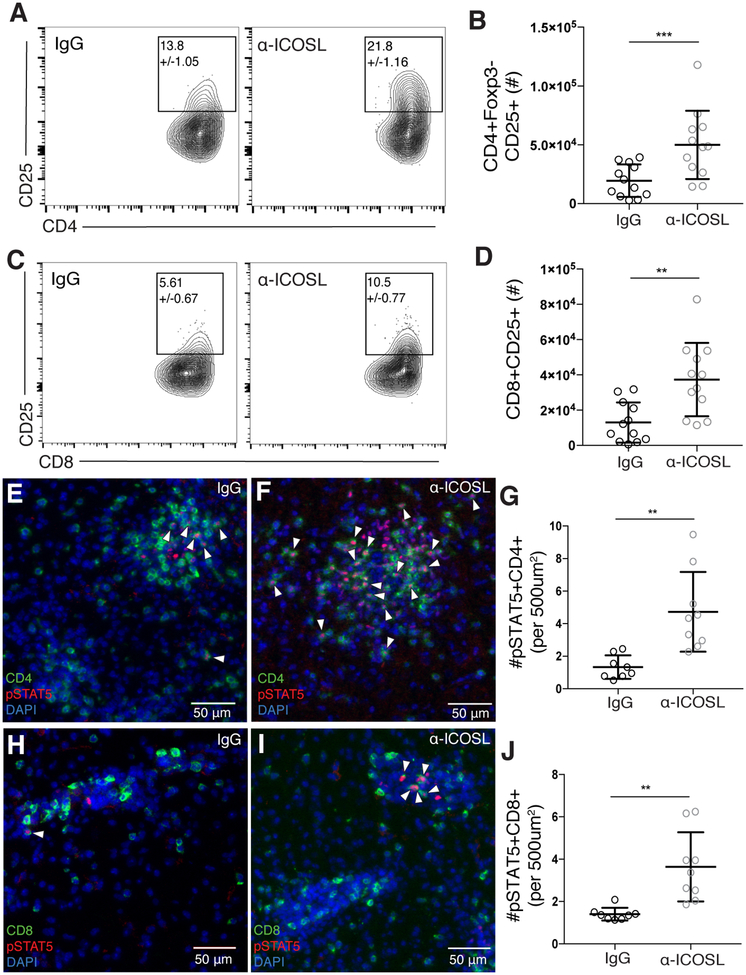
Figure 4. ICOSL blockade increases CD25 expression and STAT5 phosphorylation in effector T cells in the brain during chronic infection.
(A-D) T cells were isolated from the brains of chronically infected control or α-ICOSL-treated mice. Representative flow plots of CD25+CD4+ effector T cells (A) and CD25+CD8+ effector T cells (C) are shown. Number in gate indicates the mean frequency of CD25+ cells ± standard error. (B) Total number of CD25+ CD4+ effector T cells and (D) total number of CD25+ CD8+ T cells isolated from the brain (n=4 per group, data is pooled from 3 independent experiments and analyzed by randomized block ANOVA). (E-F and H-I) Brain sections from chronically infected control (E, H) and α-ICOSL-treated (F, I) mice were stained for CD4 or CD8 (green), pSTAT5 (red) and DAPI (blue). White arrowheads indicate pSTAT5+ CD4 or CD8 T cells. (G) The number of pSTAT5+CD4+ and (J) number of pSTAT5+CD8+ T cells were quantified per 500 μm2 (n=4–5 mice per group, data is pooled from two independent experiments and analyzed using randomized block ANOVA). * denotes p<0.05, ** denotes p<0.01, and *** denotes p<0.001 for all panels.

