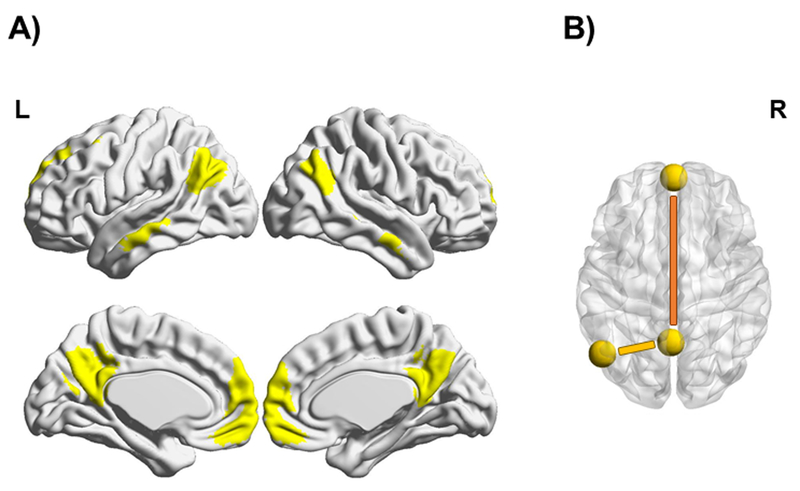
Figure 2.
A) The DMN mask covering the most important regions of this network is shown in yellow on the standard MNI map. B) The two functional couplings used for analyzing long-range and local connectivity within the DMN. The long-range DMN connectivity measure (mPFC-to-PCC) is shown in orange, while the local DMN connectivity measure (Stim-to-PCC) is shown in yellow. The yellow spheres represent the selected DMN seeds.

