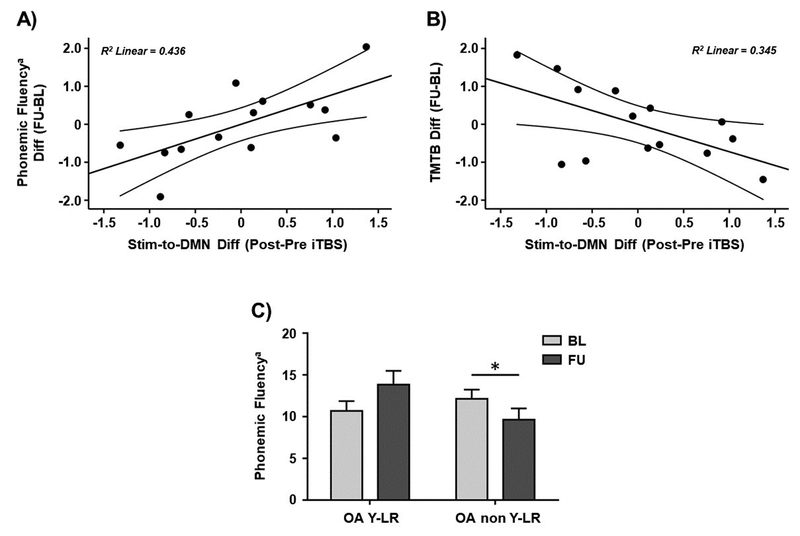
Figure 7.
Scatter plots showing the relationships between iTBS-induced changes in the DMN rs-FC observed in the main experimental day and the difference in A) phonemic fluency and B) TMTB scores between the follow-up and baseline. C) Bar chart showing significant interactions and pairwise post-hoc comparisons between the older adults with ‘young-like’ and ‘non-young-like’ responses with regards to phonemic fluency at both timepoints. Data in A) and B) are presented with adjusted z scores. Data in C) are represented as mean with SEM. a Phonemic fluency for letter M. * Significant differences (p < 0.05). Abbreviations: Stim, stimulation site; DMN, default-mode network; Diff; difference; iTBS, intermittent theta-burst stimulation; FU, follow-up; BL, baseline; TMTB, Trail Making Test B; OA YL-R, older adults with ‘young-like’ responses; OA non YL-R, older adults with ‘non-young-like’ responses.

