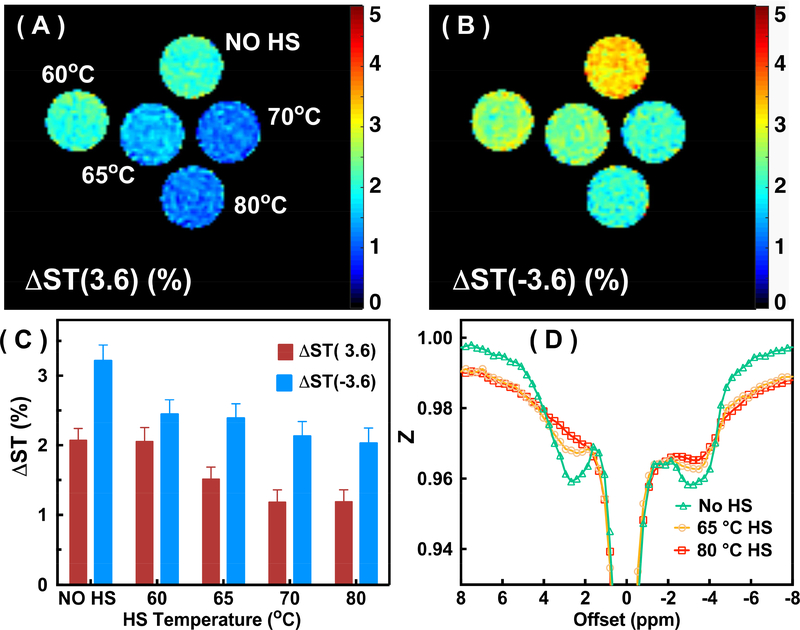
Fig 4.
The ΔST(3.6) (A) and ΔST(−3.6) (B) maps for the BSA solutions without heat shock (HS) (No HS) and after HS treatment at 60°C, 65°C, 70°C and 80°C. The maps were recorded using the UTE-CEST method with the parameters given in Fig. 3, and the ΔST values were calculated by subtracting the signals at 8 ppm and ±3.6 ppm of the Z-spectrum. (C) The ΔST(±3.6) values for the different tubes. (D) Z-spectra of the BSA solution before and after HS treatments (at 65°C and 80°C). Notice the signal reduction in the proton spectral range for mobile components and the broadening of the background signal.

