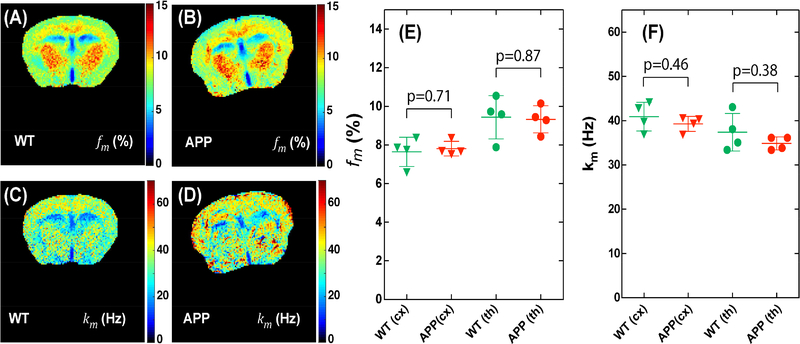
Fig 8.
Comparison of maps of macromolecular fraction fm (A,B) and exchange rate km (C,D) for WT (A,C) and APP (B,D) mice. The in-plane resolution is 0.17×0.17 mm2 with a slice thickness of 1 mm. The corresponding regional values of the macromolecular fraction (E) and exchange rate (F) for cortex (cx) and thalamus (th) in all mice studied.

