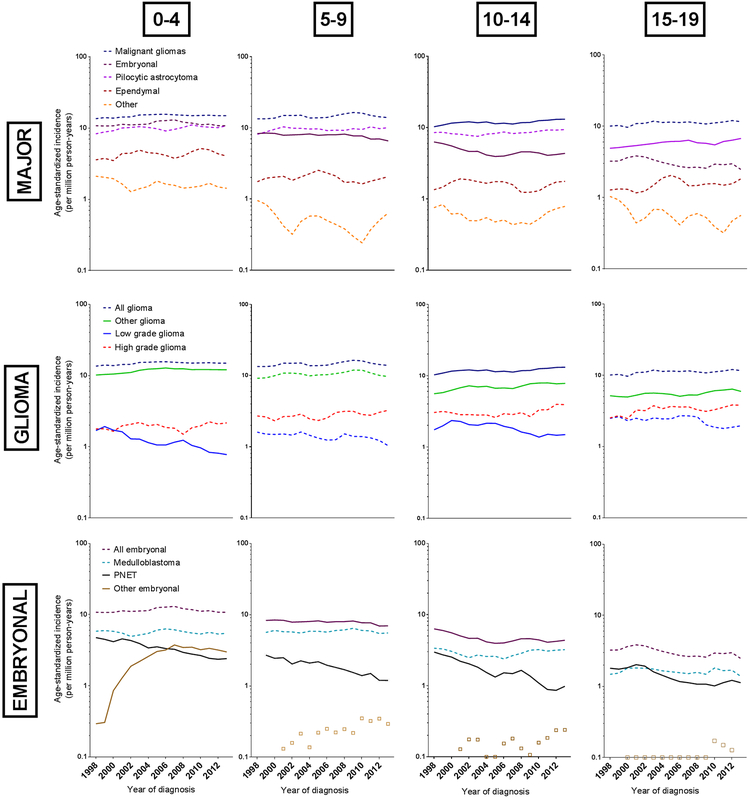
Figure 1.
Age-specific incidence rate of brain/CNS cancers per million person-years, by subtype and age at diagnosis, 3-year moving average, 1998–2013. From left to right, the columns of graphs show incidence rates for children ages 0–4, 5–9, 10–14 and 15–19 years of age. From top to bottom, the rows of graphs show incidence rates for all major subtypes, glioma subtypes and embryonal cancer subtypes. Solid lines indicate significant trends. Lines omitted when there were two few cases for a trend analysis. Colour legend: dark blue: malignant glioma; purple: embryonal cancer; fuchsia: pilocytic astrocytoma; orange: other; green: other glioma; red: high grade glioma; royal blue: low grade glioma; teal: medulloblastoma; black: PNET; brown: other embryonal.

