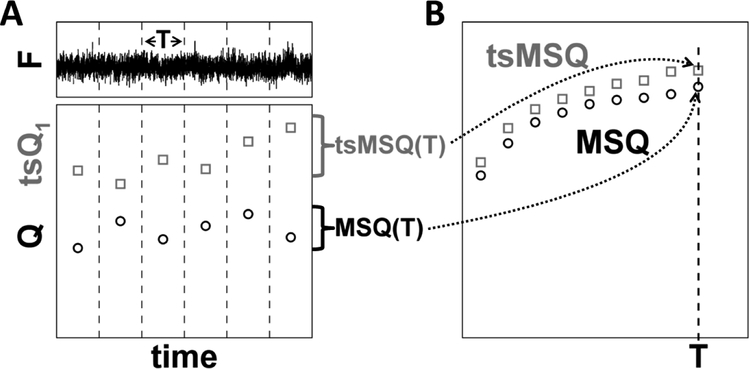
Fig. 4. Construction of MSQ and tsMSQ curves.
A) The recorded fluorescence intensity signal is divided into segments of period T (top panel). Q or tsQ1 is calculated for each of these segments (bottom panel). B) The Q-values for the segment time T are converted by an algorithm into an MSQ(T) value. Similarly, the tsQ1 values are converted into a tsMSQ(T) value. Repeating this procedure for a range of segment times identifies the experimental MSQ or tsMSQ curve.

