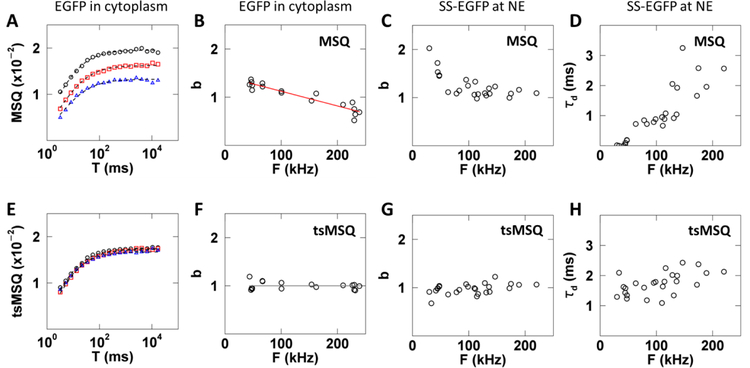
Fig. 5. Results of MSQ and tsMSQ analysis of FFS data collected for EGFP and SS-EGFP within the cytoplasm and NE, respectively.
A – D) Results based on MSQ analysis include biases. E – H) Results based on reanalysis by tsMSQ removes bias. A) MSQ curves from EGFP expressing cells with low (black circles), medium (red squares), and high (blue triangles) intensities with fits (dashed lines). B) Biased b from MSQ vs. intensity for EGFP expressing cells (n = 17) with a linear fit (red line) representing first-order non-ideal detector effects (Eq. (53)). C) Biased brightness from MSQ vs. intensity for SS-EGFP expressing cells (n = 13). D) Biased diffusion time from MSQ for SS-EGFP vs. intensity. E) tsMSQ curves from EGFP expressing cells with low (black circles), medium (red squares) and high (blue triangles) intensities with fits (dashed lines). F) b from tsMSQ for EGFP vs. intensity and the average brightness (grey line). G) Brightness from tsMSQ for SS-EGFP vs. intensity. H) Diffusion time from tsMSQ for SS-EGFP vs. intensity.

