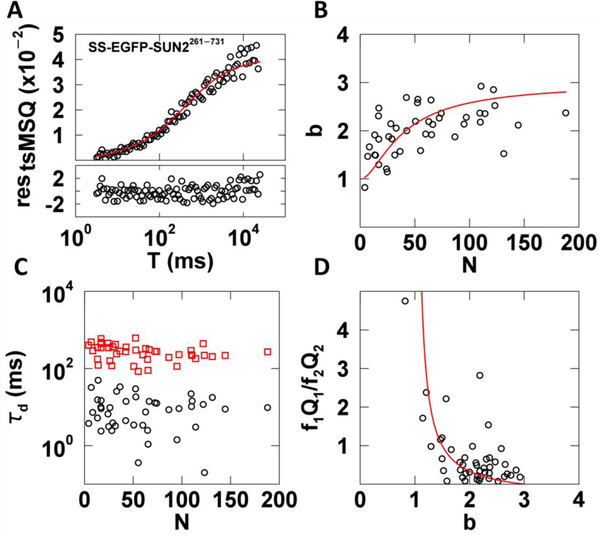
Fig. 7. tsMSQ analysis of SS-EGFP-SUN2261−731 within the NE.
A) Decorrelated tsMSQ curve with a fit to a two species diffusion model (Eq. (18)) with residuals calculated from experimental uncertainty. B) Plot of b vs. N of SS-EGFP-SUN2261−731 in the NE (n = 23 cells) with a fit to a monomer / trimer binding model (red curve). C) Diffusion times from tsMSQ fits identify a fast (black circles) and a slow (red squares) diffusing species. D) Plot of relative amplitude of the fast species to the slow species vs. b with a model of a transition from fast monomers to slow trimers (red line).

