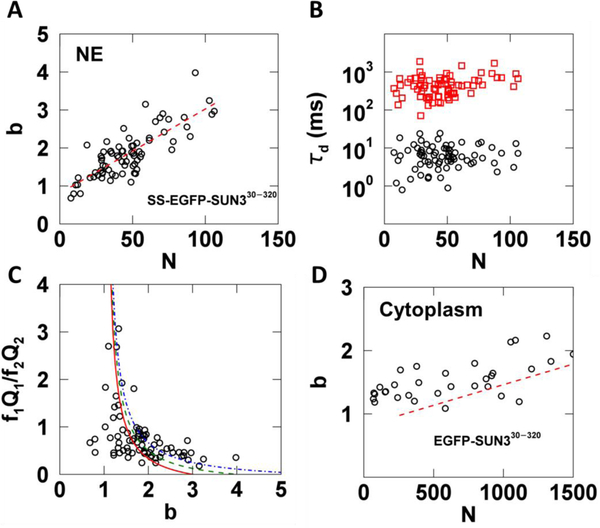
Fig. 8. tsMSQ analysis of EGFP tagged SUN330−320 within the NE and cytoplasm.
A-C) Results from fitting tsMSQ data from SS-EGFP-SUN330−320 within the NE to a two species diffusion model. A) Plot of b vs. N for SS-EGFP-SUN330−320 measured within the NE (n = 41 cells) together with a linear fit to data (red dashed line). B) Diffusion times from two species fits of MSQ curves showing both a fast (black circles) and slow (red squares) component. C) Relative amplitude of the fast component to the slow component vs. brightness. The lines represent a monomer / trimer (solid red), monomer / tetramer (dashed green), and monomer / hexamer (dashed-dotted blue) transition. D) Plot of b vs. N for EGFP-SUN330−320 within the cytoplasm (n = 32 cells) with best fit line from NE (red dashed line) after converting N from the NE to its equivalent cytoplasmic value.

