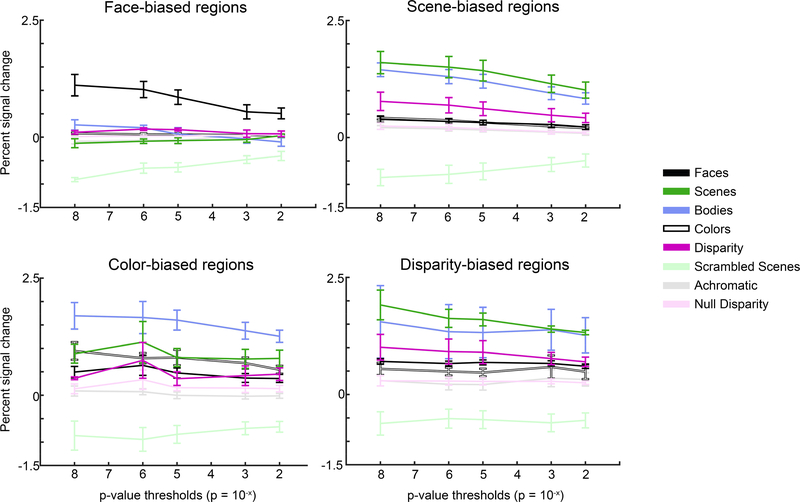
Figure 14. Selectivity of functional regions of interest in prefrontal cortex and inferior temporal cortex (IT).
A. Each point shows the mean selectivity index obtained for the given ROI, averaged over all hemispheres in PFC. B. Scatterplot showing relationship between mean selectivity of ROIs in PFC (y-axis) and mean selectivity of the corresponding functionally defined ROIs in IT (x-axis). Error bars are SEM.

