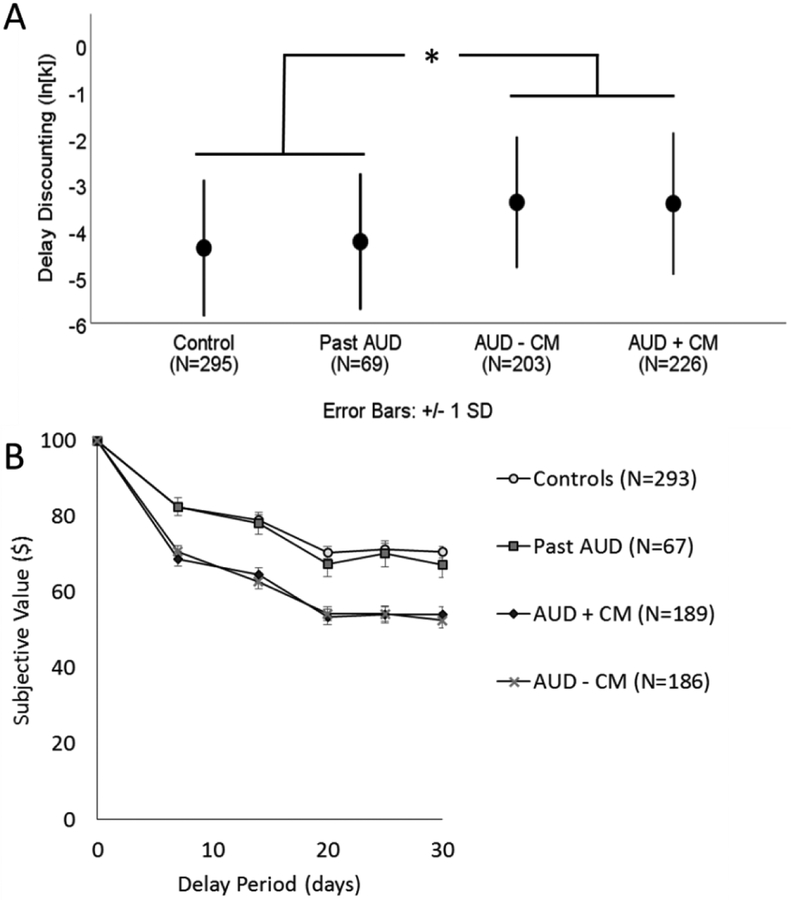
Figure 1.
Panel A shows the mean of the delay discounting metric, ln(k), for the control group (mean=−4.38, SD = 1.47), individuals who with past alcohol dependence (Past AD, mean= −4.24, SD = 1.47), individuals who with current alcohol dependence but no comorbidity (AUD – CM, mean = −3.41, SD = 1.44), and individuals with current alcohol dependence and comorbidities (AUD + CM, mean = −3.41, SD = 1.52). Error bars represent standard deviations. After adjusting for sex, age, and socioeconomic status, the pairwise comparison between controls and AUD – CM was significant, but no other pairwise comparisons were significant. Panel B depicts the subjective value of $100 after each of the 5 delays by group. The markers represent the mean of the group and the error bars represent one standard deviation. Each individual’s subjective value was determined by the indifference point, the value at which they would equally prefer $100 after the delay or the smaller, immediate amount. The number of participants depicted in Panel B is less than in the final sample because the raw data for decisions was lost for some current and past alcohol dependent participants, although the summary data (k) for these participants was preserved. * indicates p<0.05

