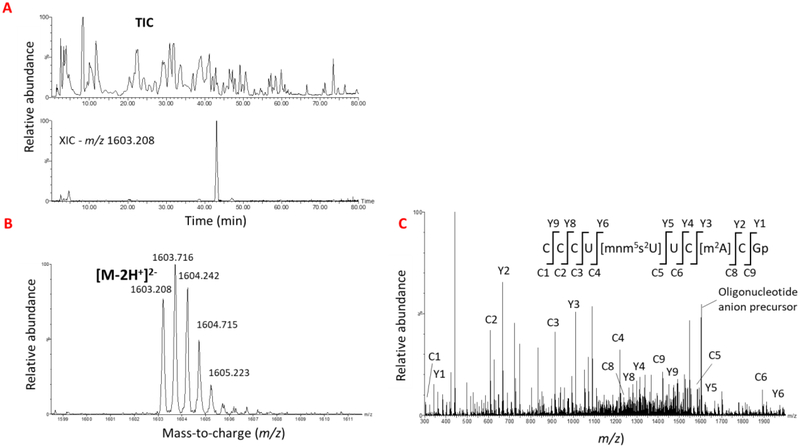
Figure 5:
A typical LC-MS/MS-based sequencing of modified oligonucleotides to identify the location of modification. (A). The total ion Chromatogram (TIC) of Rnase T1 digest of E. coli total tRNA representing the elution pattern of all the ions coming from a reverse phase column is shown. The bottom panel shows the XIC for m/z 1603.208 corresponding to oligonucleotide, CCCU[mnm5s2U]UC[m2A]CGp from tRNAGlu is shown. (B) oligonucleotide precursor ion observed in the mass spectrum of the XIC peak is depicted. (C) Tandem mass spectrum of product ions generated by CID from oligonucleotide precursor is shown. The sequence informative fragment ions that bear the common 5’-end (cn ion series) or 3’-end (yn ion series) of oligonucleotide are labeled on the sequence. The vertical lines represent the points of phosphodiester cleavage leading to formation of c and y product ion series.

