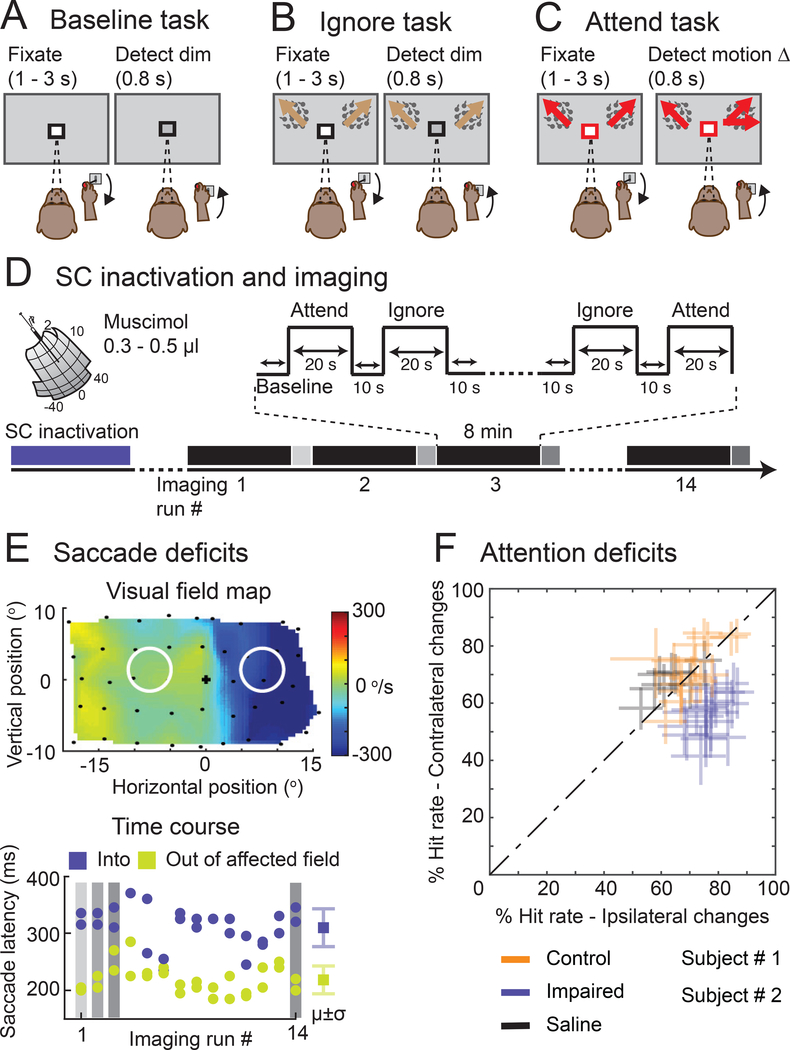
Figure 1. Behavioral tasks and neglect-like spatial attention deficits caused by SC inactivation.
(A) In the Baseline task, a black square around the central fixation spot instructed the monkey to monitor the fixation stimulus and detect luminance-change during a delay period of 1 – 3 seconds. (B) In the Ignore task, a black square around the central fixation spot instructed the monkey to monitor the fixation stimulus in the presence of peripheral motion distractors and detect luminance-change during a delay period of 1 – 3 seconds. Independent of the fixation spot dimming, one of the motion stimuli changed direction which the monkey ignored as part of the task. (C) In the Attend task, a red square around the central fixation spot instructed the monkey to monitor both the peripheral motion stimuli and detect a possible motion direction-change that occurred in one of the motion stimuli during a delay period of 1 – 3 seconds (Video S1). The central fixation spot did not dim during Attend condition. In all tasks, the monkey reported the relevant change by releasing the joystick within 0.8 s for a juice reward. (D) Timeline of an example SC inactivation session and imaging. The session began with reversible inactivation of SC outside the scanner. In the scanner, the monkey performed all three tasks presented in a block design during an imaging run that lasted 8 minutes (black bars). At the end of each imaging run, the monkey performed visual guided saccades to targets in the affected and unaffected visual fields (grey bars). An average of 14 imaging runs were collected in an inactivation session. (E) The visual field map shows the effect of SC inactivation on the peak velocity of the saccades to targets in the visually guided saccade task (top panel). The blue region indicates the affected part of the visual field. Black dots indicate the retinotopic position of the saccade targets. The white circles indicate the positions of the motion stimuli in the Ignore and Attend tasks. The time course of muscimol effect was measured in the scanner using visual guided saccade task at the end of each imaging run (bottom panel). Blue dots indicate the latencies of saccades to targets in the affected visual field and green dots indicate the latencies of saccades to targets in the unaffected visual field. μ and σ indicate mean and standard deviation respectively. (F) Performance in Attend task is shown for control (green), impaired (SC inactivation; blue) and saline (black) sessions in both monkeys. % Hit rate for motion changes in the affected visual field (y-axis) is plotted against % hit rate for motion changes in the unaffected visual field (x-axis). Each data point represents a single session and error bars indicate 95% CI. See also Video S1.

