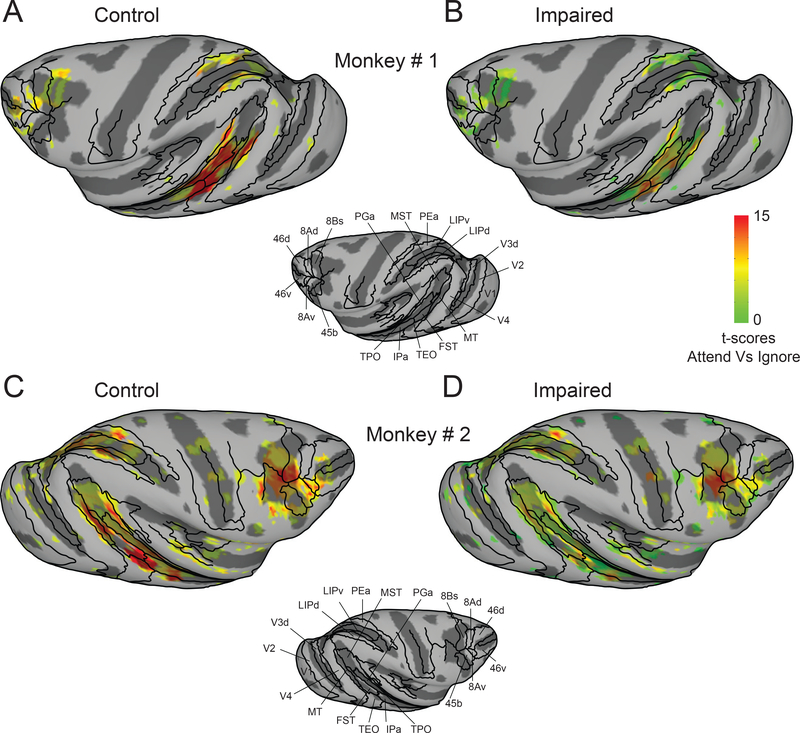
Figure 2. Cortical maps of attention-related modulation in control and impaired (SC inactivation) sessions.
T-scores contrasting Attend and Ignore tasks were projected onto inflated cortical surfaces of D99 in each monkey’s native space along with anatomical boundaries (black contours). (A,B) Inflated cortical maps of t-scores show attention-related modulation in ipsilateral (left) hemisphere of monkey # 1 during control (A) and impaired (B). The maps were thresholded during control sessions (A) and the modulation for the same voxels is shown during the impaired sessions (B). (C,D) Same conventions as (A,B) but for monkey # 2. See also Figure S1.

