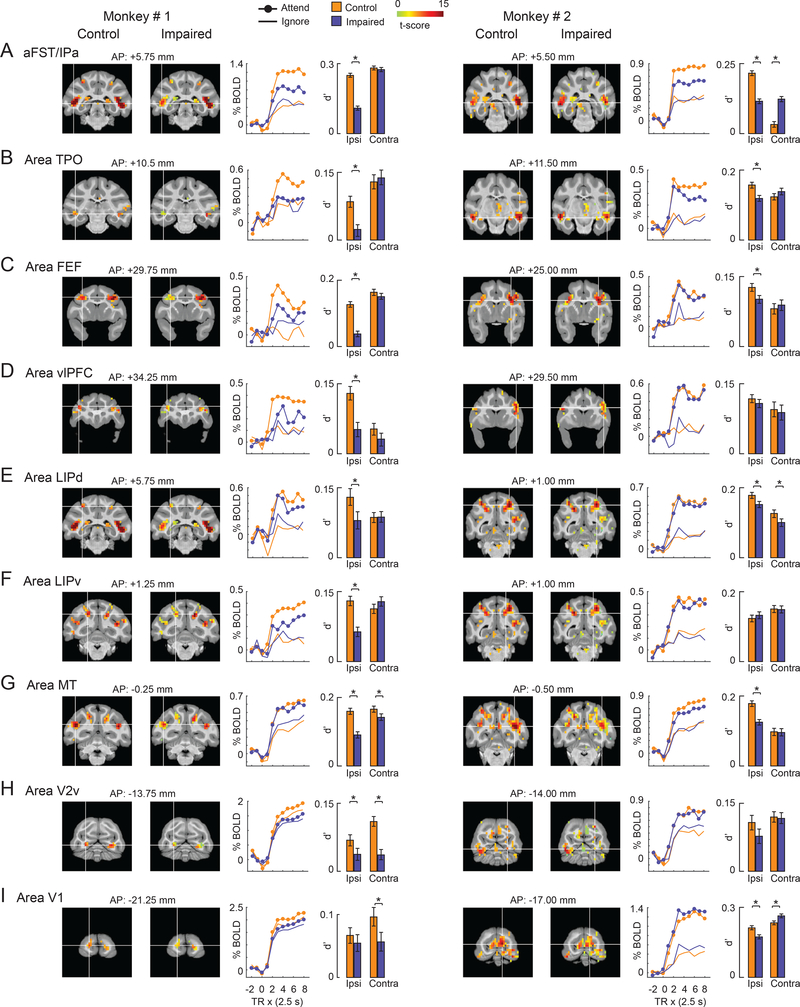
Figure 4. Effect of SC inactivation on the attention-related modulation in cortical ROIs.
(A-I) The name of the ROI is shown at the top-left of each row. Each row shows coronal slices containing the peak of the ROI for both monkeys (Monkey # 1: Left column; Monkey # 2: Right column). The coronal slices overlaid with attention-related modulation during control and impaired (SC inactivation) sessions are shown next to each other for comparison. The location of the white cross-hair in each coronal slice indicates the peak of the ROI in the hemisphere ipsilateral to the SC inactivation site. Note that the peak of the ROI was identified based on the attention-related modulation during control. The location of the coronal slice w.r.t the inter-aural axis is shown on top of each coronal slice. Next to the coronal slices, mean BOLD time-courses for the ipsilateral ROI are plotted as % change in BOLD on y-axis against repetition time (TR) on the x-axis for the Attend (filled circles) and Ignore (open circles) tasks performed during control (orange) and impaired (blue) sessions. TR = 0 on x-axis indicates start of the block. The bar plot shows the attention-related modulation in the ipsilateral ROI measured as d’ during control (orange) and impaired (blue) sessions. For comparison, the same measure is shown for the corresponding contralateral ROI during control and impaired sessions. Error bars indicate bootstrapped 95% CI and ∗ indicates statistical significance at 5% after correcting for multiple comparisons (p < 0.05; Bonferroni corrected). aFST refers to anterior part of anatomical area FST. See also Figures S3 and S4.

