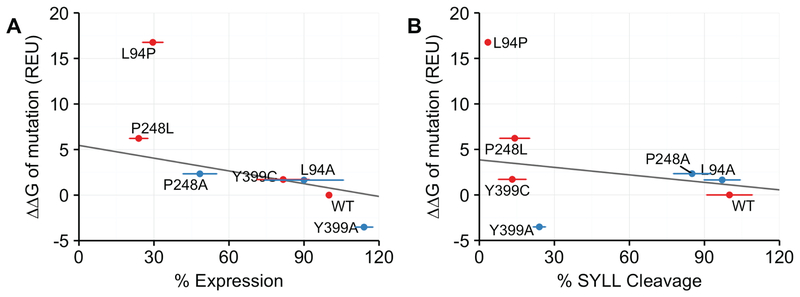
Figure 5. Comparison of calculated ΔΔGmut values for mutant ZMPSTE24 alleles with experimental data for ZMPSTE24 stability and prelamin A cleavage activity from Fig. 4B and Fig.4C.
ΔΔGmut is the predicted difference in free energy of folding between a WT and mutant protein. A) The calculated ΔΔGmut values in Rosetta Energy Units (REU) (y axis) for the indicated mutant alleles of ZMPSTE24 is compared with the level of ZMPSTE24 stability (denoted as expression; × axis) from the assay shown in Fig 4B. When the proline mutation L94P is excluded, the correlation coefficient is −0.843. (B) Comparison of ΔΔGmut calculations (y axis) with percentage of prelamin A cleavage determined in Fig. 4A (x axis). When the proline mutation L94P is excluded, the correlation coefficient is −0.207. Disease variants are in red and additional variants are in blue. Horizontal error bars are the standard deviation of the mean taken from Fig 4.

