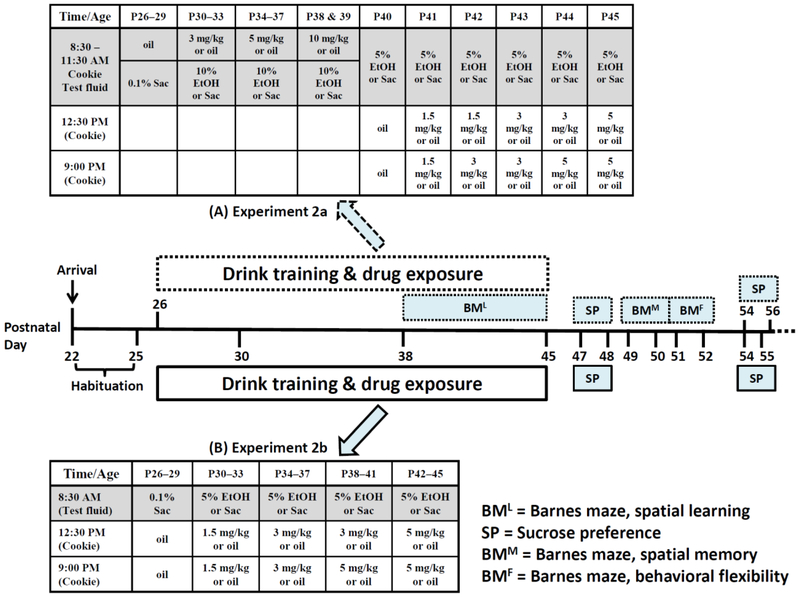
Fig. 2.
Timeline of chronic oral THC consumption and voluntary alcohol drinking. Treatments indicated in the shaded part of the tables occurred during the last 3-h of the dark cycle. (A) Manipulations in Experiment 2a (CTL & EtOH, n = 8/group; THC_C, n = 5; THC_A, n = 3; COM_C & COM_A, n = 4) are indicated in the dotted boxes and top table. The “A” or “C” following the underscores denote “Avoiders” and “Consumers” of THC-laden cookie, respectively. The transition from paradigm 1 to 2 occurred on P40.. (B) Manipulations in Experiment 2b (CTL, n = 10; EtOH & THC, n = 8/group; COM, n = 7) are indicated in the solid boxes and bottom table. Barnes maze testing was not performed.

