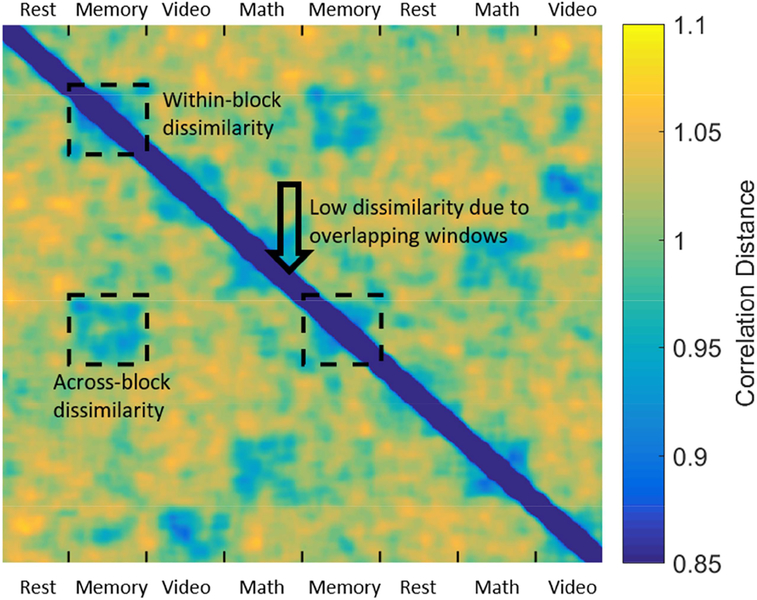
Figure 4.
Whole-brain dFC patterns (SWC, WL = 45sec) were vectorized and correlated with each other to compute a correlation dissimilarity matrix (1 - correlation). A spuriously low within-cluster dissimilarity, may arise due to the maximally overlapping sliding windows (high similarity of neighboring dFC patterns), noted by the black arrow. To account for this potential bias, we only used the dissimilarity values across two task blocks of the same task to compute a(i).

