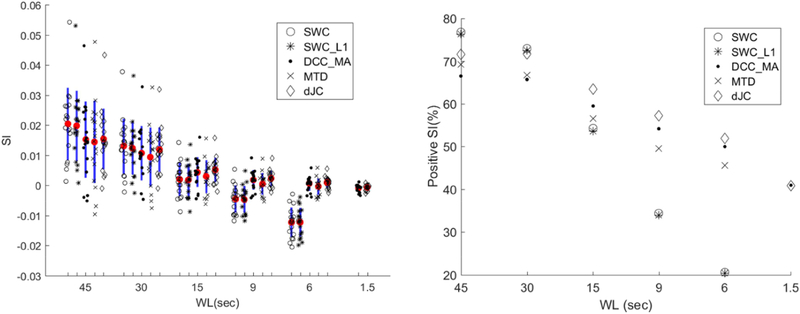
Figure 8.
Left: Graphical summary of SI. Each shape represents the subject-average SI derived from a given dFC method. Mean is highlighted by the red dot and one standard deviation was shown in blue. The two columns to the right are the SI of both framewise methods (DCC and JC). Right: Percentage of positive SI of different dFC methods across different WLs.

