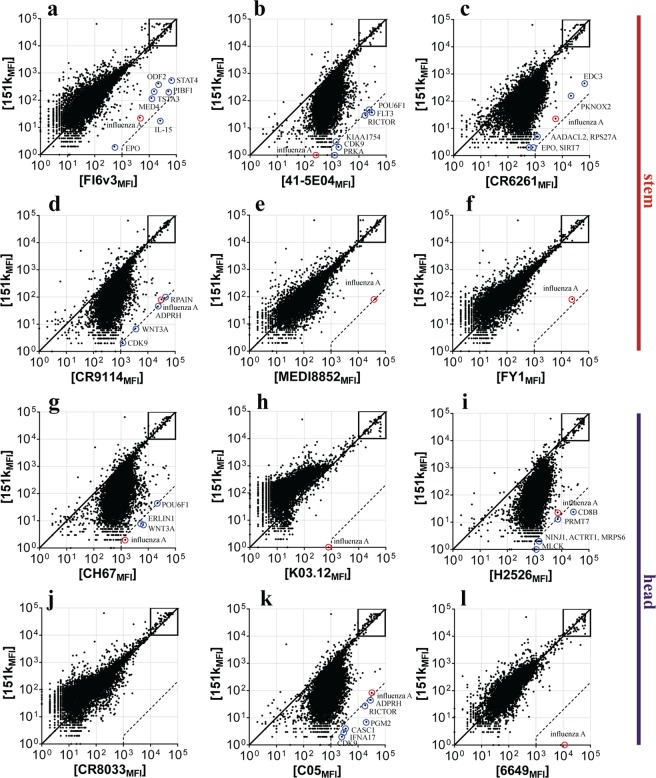
Figure 4.
Protein microarray binding of influenza HA bnAbs. (a–l) Representative ProtoArray summary for protein arrays blotted with (a) FI6, (b) 41-5E04, (c) CR6261, (d) CR9114, (e) MEDI8852, (f) FY1, (g) CH67, (h) K03.12, (i) H2526, (j) CR8033, (k) C05, (l) 6649 or 151 K control. Axis values are relative fluorescence signal intensity (MFI) in the 151 K array (y axis) or test mAb array (x axis). Each dot represents the average of duplicate array proteins. A diagonal line indicates equal binding by test mAb and 151 K. Internal controls for loading of mAb and secondary detection reagent were equally bound by mAb pairs (boxes). Dashed lines indicate the 500-fold signal/background ratio defined as the cutoff for autoreactivity. Circles identify protein autoligands recognized by autoreactive bnAbs.

