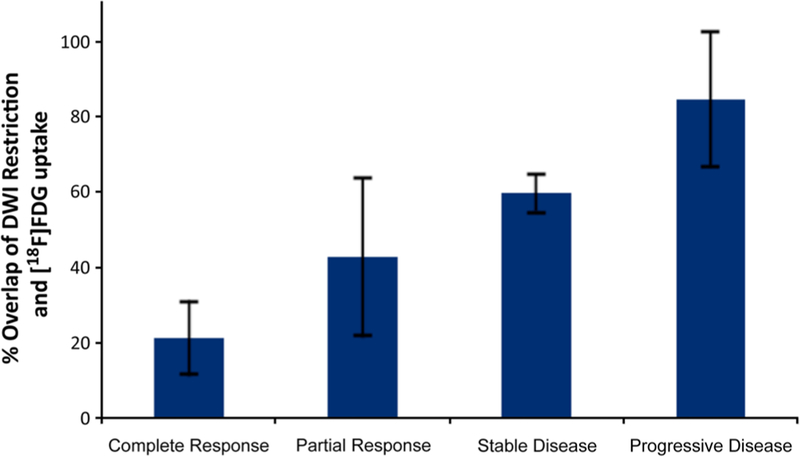
Fig. 1.
Predictive value of the relative tumor volume with combined restricted diffusion and [18F]FDG hypermetabolism in RMS. Mean tumor volume with both restricted diffusion and [18F]FDG hypermetabolism at baseline (calculated as DWI and [18F]FDG positive tumor volume/whole tumor volume × 100 %) increases with decreasing response to chemotherapy, as determined by RECIST criteria at 15 weeks after start of chemotherapy (p < 0.0001). Data are displayed as mean values for each response group and standard deviations.

