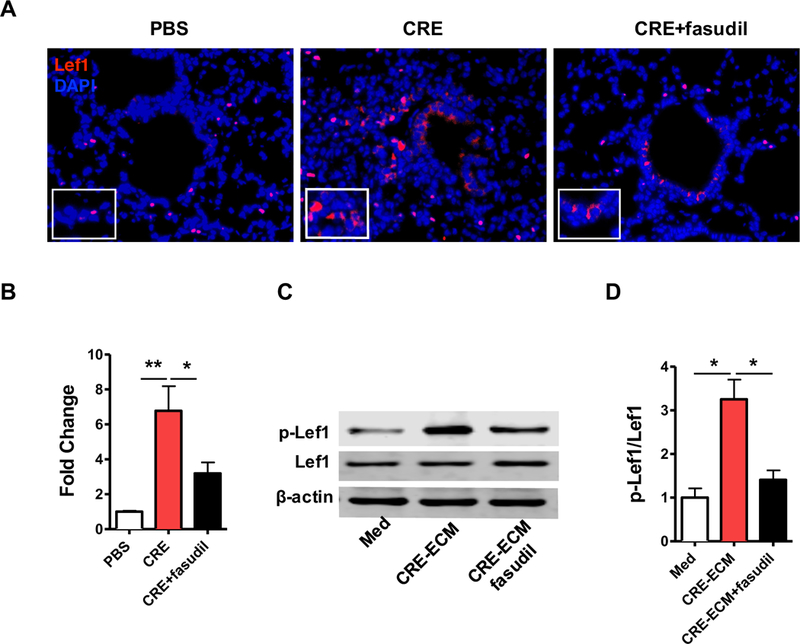
FIG 6.

RhoA signaling induces Lef1 activation in MSCs. A, Representative image of immunofluorescence staining for lef1 in lung section (n=5/group). B, RT-PCR analysis of Lef1 expression in lung tissues (n=5/group). C, Representative immunoblots for total Lef1 and phosphote-Lef1 (p-Lef1) in MSCs. β-actin was used as a control. n=3. D, Densitometric analysis for Lef1. Data represent mean ± SEMs. *P<0.05, **P<0.01.
