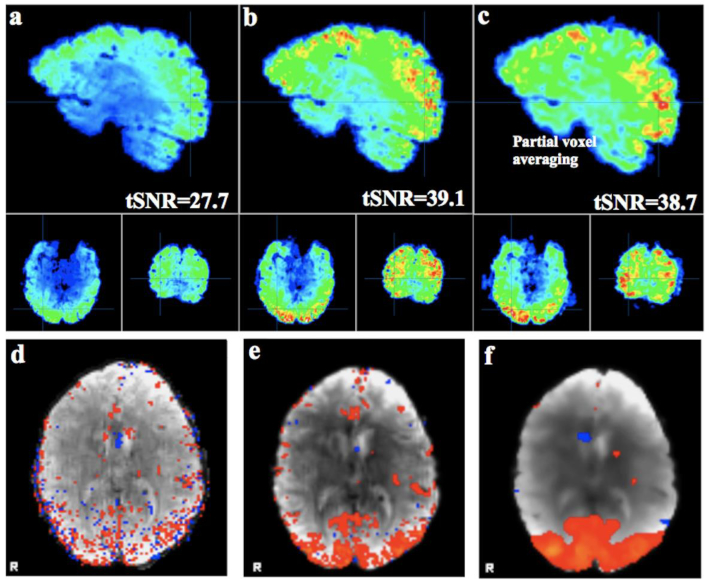
Fig. 1.

Temporal signal-to-noise ratio (tSNR) maps from a representative sample subject data from the HCP study. Maps shown are for raw data (a), filtered data using the MPPCA filter (b), and applying Gaussian kernel smoothing (σ=2mm) on the raw data yielding the average tSNR close to the tSNR of the filtered data using MPPCA filter (c). The impact of the denoising on the state visual network demonstrated by localization of the activity to the cortical gray matter in the MPPCA denoised data (e) versus raw data (d) and Gaussian smooth data (f) in bottom row.
