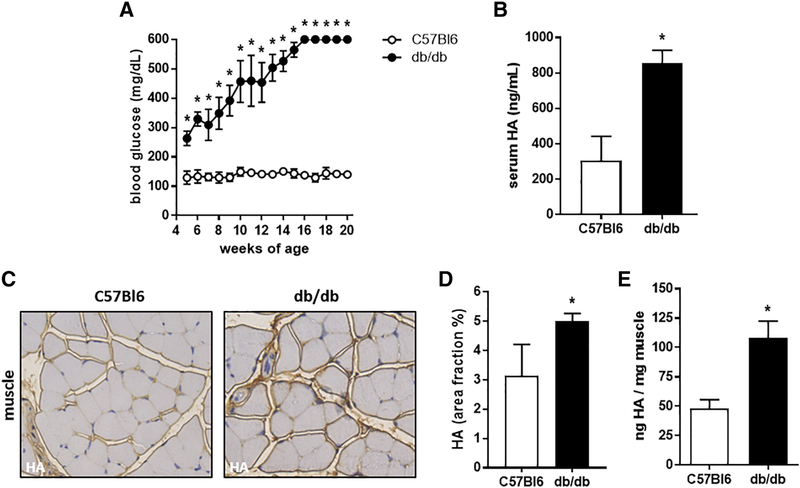
Figure 2: Serum and muscle HA concentrations are significantly elevated in a T2D mouse model.
A: Blood glucose of db/db and C57Bl6 mice from 4 to 20 weeks of age. B: Serum HA level from db/db and C57Bl6 mice. C: Representative images of skeletal muscle images from db/db and C57Bl6 mice stained for HA, in brown. D: Quantification of HA accumulation in skeletal muscle from IHC images. E: Quantification of HA content of skeletal muscle from db/db and C57Bl6 mice. N = 5–10 mice per group. Data represent mean +/− SEM, *P < 0.05 vs the respective control by unpaired t test.

