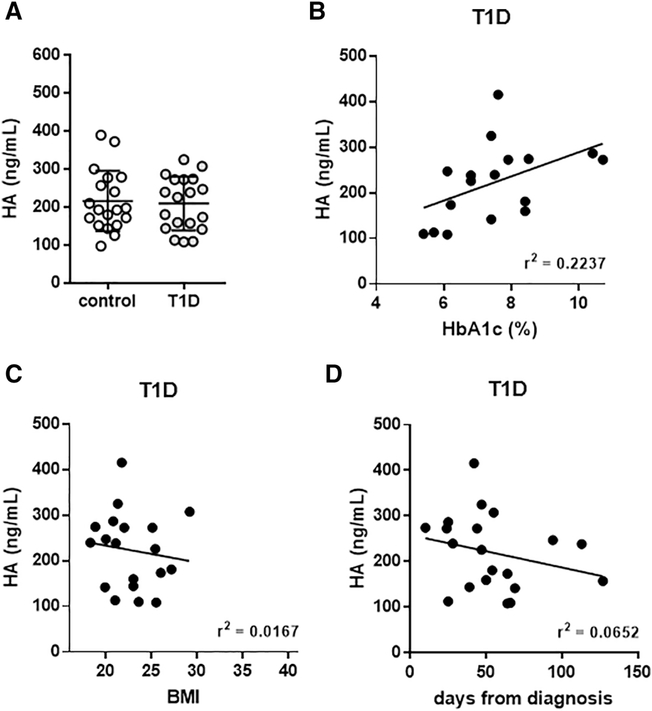
Figure 4: Serum and muscle HA concentrations are not elevated in T1D patients.
A: Serum HA measurements in T1D and healthy control subjects. B: Relationship between serum HA and HbA1c. Mean serum HA values for each individual in the study are shown in conjunction with the HbA1c level measured for that given individual at the time of blood draw. C: BMI and (D) days from diagnosis are shown in correlation with HA. N = 1720 per group. Data in A represent mean +/− SEM, data in B-D are shown as regression plots. *P < 0.05 vs control by unpaired t test.

