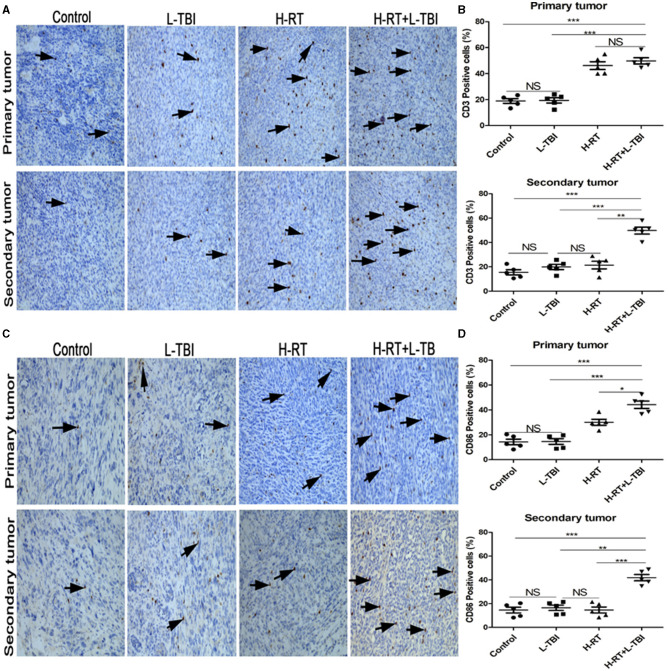
Figure 4.
Comparison of CD3+ and CD86+ lymphocytes in different treatment groups. (A) Representative images of CD3 IHC in tumor tissues of different treatment groups. (B) Percentage of CD3 positive cells in the primary and secondary tumor. (C) Representative IHC images of CD86 infiltration in the tumor tissue of different treatment groups. (D) Percentage of CD86 positive cells in the primary and secondary tumor. The arrows point the CD3 and Cd86 positive cells in tumor tissues from mice that received different treatments (original magnification × 200). Data are expressed as mean ± SE of 5 mice/group. (*P < 0.05, **P < 0.01, ***P < 0.001, and NS = not significant).

