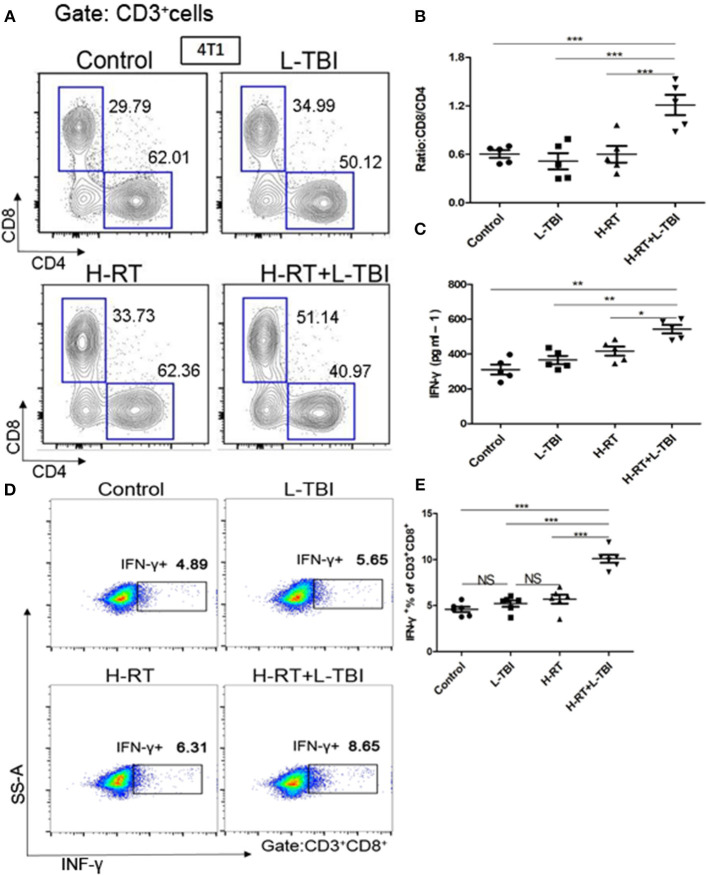
Figure 5.
Expression of CD8+/CD4+ T cells in mice treated with H-RT and L-TBI radiotherapy. (A) The frequencies of CD8+ and CD4+ cells induced in the secondary tumor of each group (n = 5 mice/group). (B) Ratio of CD8+/CD4+ cells in the secondary tumor of each group (n = 5 mice/group). (C) ELISA results of the INF-γ levels (pg/ml) in various groups (n = 5 mice/group). (D) Representative dot plots of CD3+CD8+INF-γ+ cells in the secondary tumor tissue of control, L-TBI, H-RT, and H-RT+L-TBI group (n = 6 mice/group). (E) Comparison plot of CD3+CD8+INF-γ+ cells in the secondary tumor tissue of different various groups (n = 6 mice/group). The cells were gated on living lymphocytes and then on CD8+ and CD4+ cells and the percentages of CD3+CD8+INF-γ+ T-cells were determined by flow cytometry analysis. Data are representative charts or the percentages of individual subjects. The lines indicate median values for each group. (*P < 0.05, **P < 0.01, ***P < 0.001, NS = not significant).

