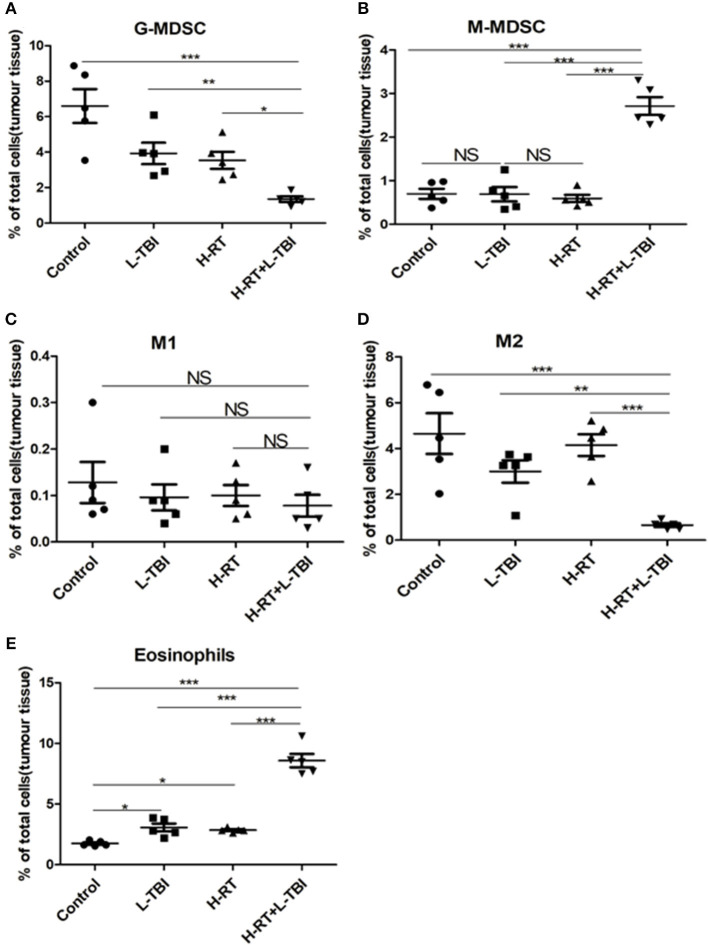
Figure 6.
Immunosuppressive microenvironment effects of H-RT and L-TBI combination therapy on 4T1 tumor-bearing mice. The percentage of the G-MDSCs (defined as CD45+CD11c−CD11b+Ly6G+Ly6clow) (A), M-MDSCs (defined as CD45+CD11c−CD11b+Ly6G−Ly6chi) (B), M1 (defined as CD45+CD11b+F4/80+ CD206−) (C), M2 (defined as CD45+CD11b+ F4/80+CD206+) (D), and Eosinophils (defined as Siglec-F+Gr1low) (E) were analyzed by flow cytometry analysis. Data are representative charts or the percentages of individual subjects. Data are expressed as mean ± SE of 5 mice/group. The statistical significance of differences was determined by ANOVA. (*P < 0.05, **P < 0.01, ***P < 0.001, and NS = not significant).

