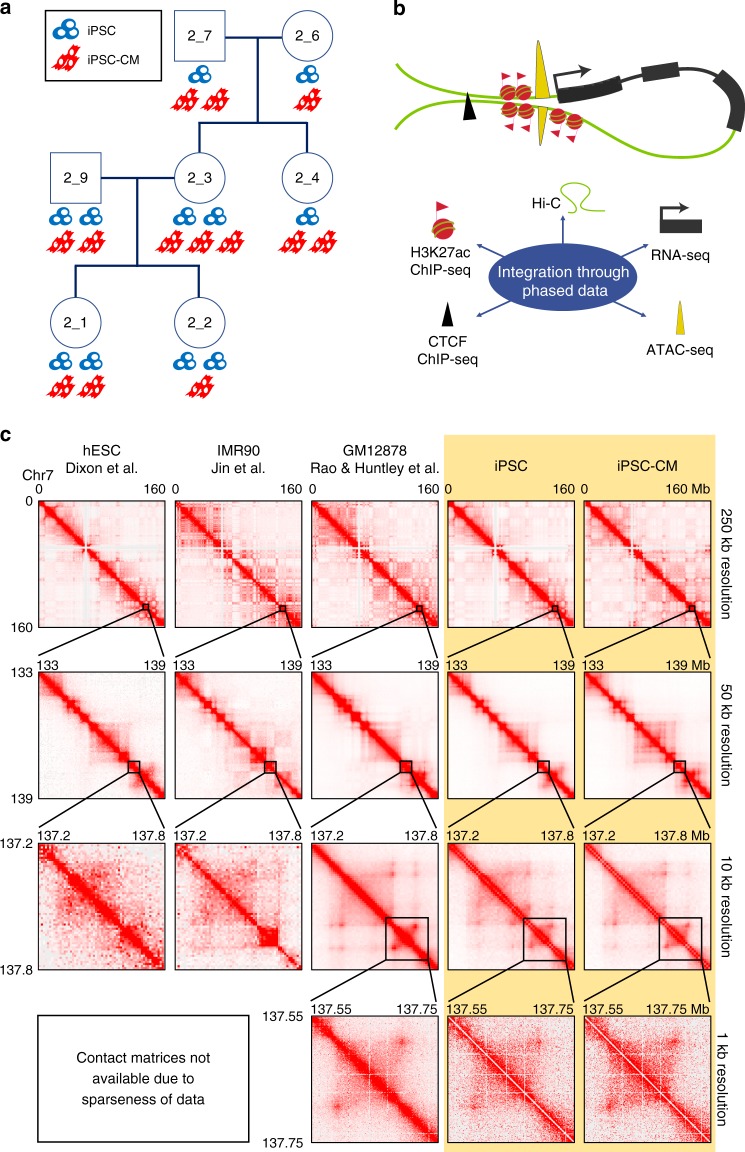
Fig. 1.
Study design, data, and chromatin contact maps. a Pedigree of the seven individuals used in this study. Cell icons below each subject indicate the number of iPSC lines and iPSC-CM samples used in the Hi-C experiments. iPSC lines are shown in blue, iPSC-CM samples are shown in red. b Schematic showing the data types used in this study depicting how they colocalize at loop anchors. c Hi-C contact maps from previous Hi-C studies (three left columns), and this study (two right columns, highlighted in yellow), displaying depth of map on Chromosome 7 (arbitrarily chosen for example). For Dixon et al.10 and Jin et al.4, the data is too sparse to zoom to 1 kb resolution

