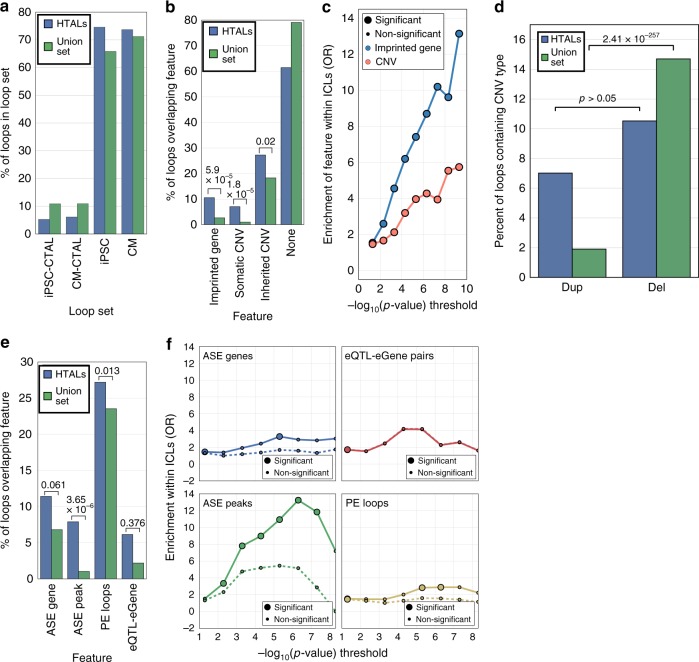
Fig. 6.
Functional characterization of haplotypic differences in chromatin conformation. a Barplot showing the percent of union loops (green) or HTALs (blue) contained within each loop set. b Barplot showing the percent of union loops (green) or HTALs (blue) containing the given genomic feature within it (i.e., the genomic feature overlapped the region between the start of the first anchor and the end of the second anchor). P-values were calculated using via a Fisher’s exact test. c Line plot showing odds ratio from a Fisher’s exact test for HTAL enrichment above the union set for containing an imprinted gene (blue) or containing either an inherited or somatic CNV (red) as a function of the –log10 of the HTAL imbalance p-value. Large circles indicate that the test was significant after Bonferroni correction, and small circles indicate a non-significant association. d Barplot showing the percentage of union loops (green) or HTALs (blue) containing only deletions or only duplications. P-values were calculated using a binomial approximation to a normal distribution, adjusted for the number of identified CNVs which were deletions vs duplications. e Barplot showing the percent of union loops (green) or HTALs (blue) overlapping the given genomic feature at an anchor. P-values were calculated using a Fisher’s exact test. f Line plot showing odds ratio from a Fisher’s exact test for HTAL enrichment above the union set for containing the labeled feature as a function of the –log10 of the HTAL imbalance p-value, for either all loops (solid lines), or loops that do not contain an imprinted gene or CNV (dashed lines). Large circles indicate that the test was significant after Bonferroni correction, and small circles indicate a non-significant association

