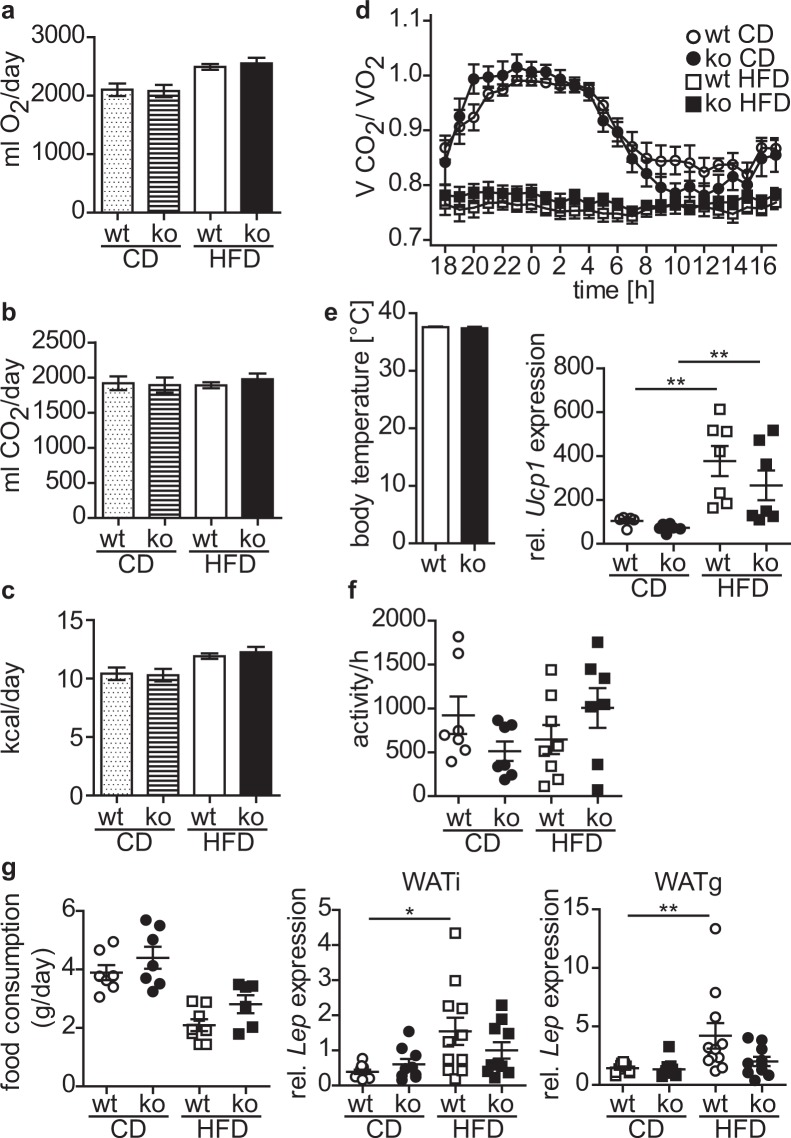
Figure 6.
HFD-fed cytohesin-3 deficient mice have a normal metabolic rate. Male wt (white symbols; white and dotted bars) and cyth3−/− mice (black symbols; hatched and black bars) received a high-fat diet (HFD, 60 kJ% fat) and control diet (CD, 13 kJ% fat), respectively. After 6 weeks mice were analyzed in metabolic cages for oxygen consumption (n = 7–8) (a) and carbon dioxide production (n = 7–8) (b). From these values energy expenditure (c) and the respiratory exchange ratio (d) were calculated. Body temperature was determined from HFD-fed mice (n = 4) (e) and Ucp1 in brown adipose tissue was analyzed by PCR. Activity (n = 7–8) (f) and food intake (n = 6–8) (g) were also determined in metabolic cages. Gene expression of Leptin in WATi and WATg was analyzed by PCR. The results are given in means or as individual data points ± SEM (*p < 0.05; **p < 0.01).

