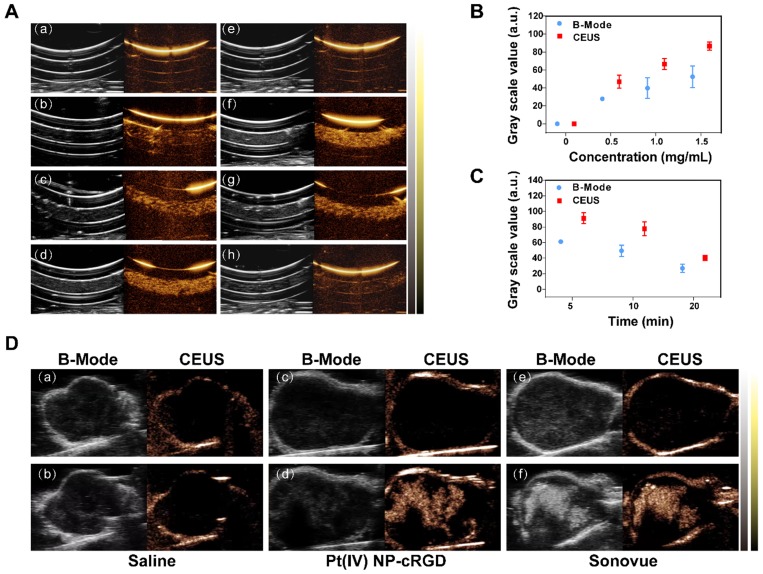
Figure 2.
US imaging in vitro and in vivo. (A) Evaluation of US imaging performance in vitro. US imaging of saline (a), 0.5 mg/mL Pt(IV) NP-cRGD (b), 1.0 mg/mL Pt(IV) NP-cRGD (c) and 1.5 mg/mL Pt(IV) NP-cRGD (d) at 1 min. (e-h) US imaging of saline (e) and 1.5 mg/mL Pt(IV) NP-cRGD after different US exposure times (f-h separately represent saline after US treatment at 5 min, 10 min and 20 min). B-mode (left) and contrast-enhanced ultrasound (CEUS) (right) image of Pt(IV) NP-cRGD. (B, C) Grayscale values of the Pt(IV) NP-cRGD changed along with the changes in concentration and US exposure time. The data are shown as the mean ± SD of three independent experiments. (D) Ultrasound images of tumors injected with saline, Pt(IV) NP-cRGD (1.5 mg/mL) and Sonovue (SF6 = 8 μL/mL). The upper panel shows the preinjection images of the tumors, and the lower panel shows the postinjection images of the tumors. B-mode (left) and CEUS (right).

