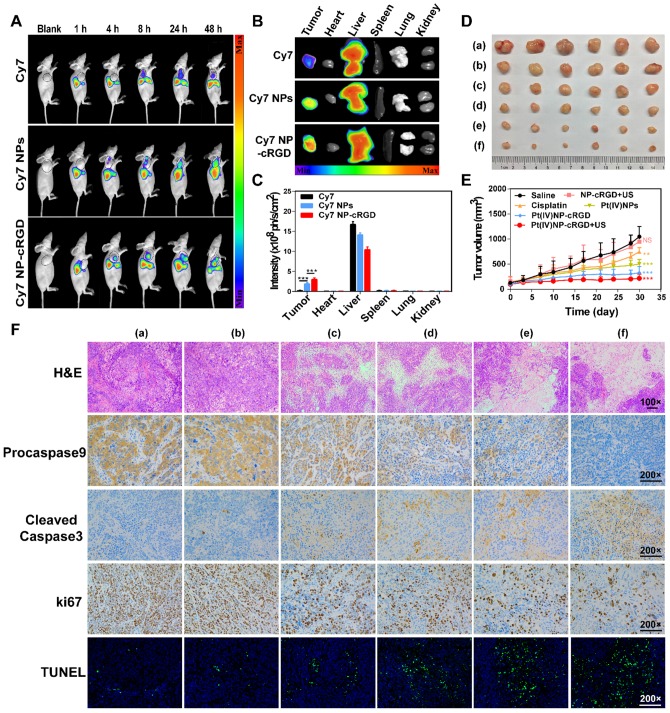
Figure 7.
Antitumor efficiency of Pt(IV) NP-cRGD with US in vivo. (A) In vivo distribution of free Cy7, Cy7 NPs and Cy7 NP-cRGD (at a Cy7 dose of 1 μg/mL) in SKOV3 tumor-bearing mice after intravenous injection for 1, 4, 8, 24 and 48 h (n = 3). (B) Fluorescence images of excised tumors and organs 48 h after the intravenous injection. (C) Quantitative analysis of the mean fluorescence intensity of Cy7 in excised tumors and organs 48 h after the intravenous injection. (D) Sizes of the tumors collected from different groups of mice 3 days after the last treatment. (a) saline, (b) NP-cRGD+US, (c) cisplatin, (d) Pt(IV) NPs, (e) Pt(IV) NP-cRGD and (f) Pt(IV) NP-cRGD+US (n = 6). (E) Tumor growth curves of tumor-bearing mice after treatment with different formulations of 2.0 mg/kg. (F) The tumor sections were stained with H&E, procaspase 9, cleaved caspase 3, Ki67 and TUNEL. The upper panels (H&E) were magnified 100-fold, and the lower panels were magnified 200-fold, Scale bar, 100 μm. (a) saline, (b) NP-cRGD+US, (c) cisplatin, (d) Pt(IV) NPs, (e) Pt(IV) NP-cRGD and (f) Pt(IV) NP-cRGD+US. The data are presented as the mean ± SD. Statistical significance in (C) was calculated by two-way ANOVA with Tukey's post hoc test. Statistical significance in (E) was calculated by two-way ANOVA with Sidak's post hoc test. *P < 0.05, **P < 0.01, ***P < 0.005, NS indicates P > 0.05.

