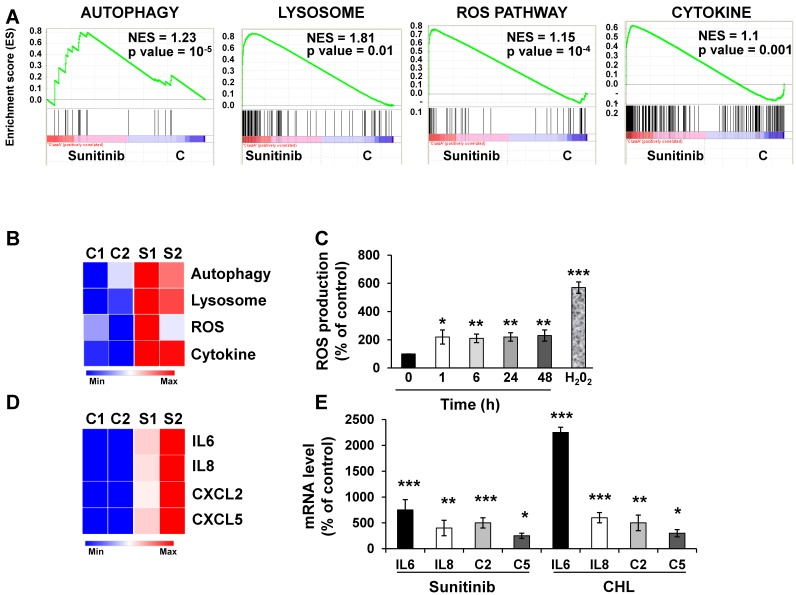
Figure 1.
Sunitinib modified the gene expression profile of RCC cells. (A) Enrichment in the KEGG terms “Autophagy, Lysosome, ROS Pathway and Cytokine”; P values and the normalized enrichment scores (NES) are indicated. (B) Heatmaps of the most up-regulated pathways in untreated 786-O cells (C1, C2) or after incubation for 48 hours with sunitinib 2.5 μmol/L (S1, S2). (C) Determination of ROS production by cells treated with 2.5 μmol/L sunitinib for the indicated times. H2O2 served as a positive control of ROS production. (D) Heatmaps of the most up-regulated inflammatory cytokines (IL6, IL8/CXCL8, CXCL2, CXCL5) in untreated 786-O cells (C1, C2) or after incubation for 48 hours with sunitinib 2.5 μmol/L (S1, S2). (E) Comparison of the mRNA levels evaluated by qPCR of untreated cells or after treatment of cells for 48 hours with sunitinib 2.5 μmol/L or chloroquine 10 μmol/L (CHL). P values are indicated; * p < 0.05; ** p < 0.01; *** p < 0.001.

