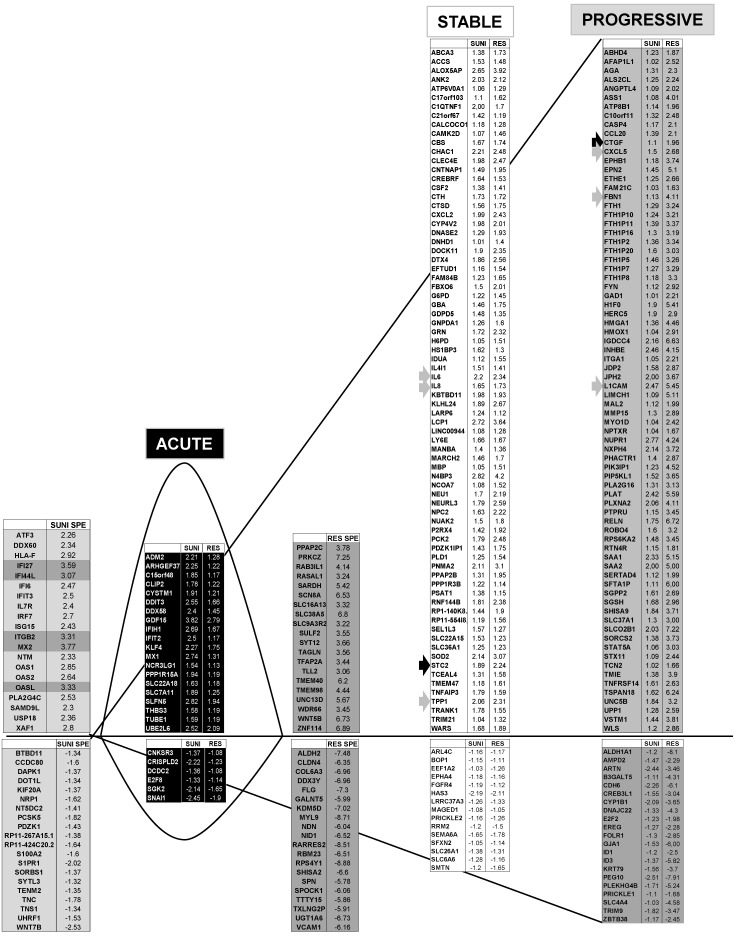
Figure 5.
Transcriptomic analysis revealed common and specific genetic programs in sunitinib sensitive and resistant cells. Fold induction/repression (log2) is shown. We defined four different genetic responses: Acute; Genes induced/repressed by sunitinib in sensitive cells for which expression returns to basal levels but remains above/below basal levels in resistant cells; Stable; Genes induced/repressed equivalently in sunitinib sensitive and resistant cells; Progressive; Genes induced/repressed in sunitinib sensitive cells and further induced/repressed in sunitinib resistant cells; Specific; response of sunitinib sensitive and resistant cells; Genes that are specifically induced/repressed in sunitinib sensitive and resistant cells. The twenty most induced/repressed genes are indicated. Genes for which fold induction/repression was above/below 3/-3 are indicated in dark grey. The grey arrow indicates a gene which is in a different category (Acute, Stable Progressive) in transcriptomic and proteomic analyses; a black arrow indicates a gene which is in the same category in transcriptomic and proteomic analyses (see Figure 6).

