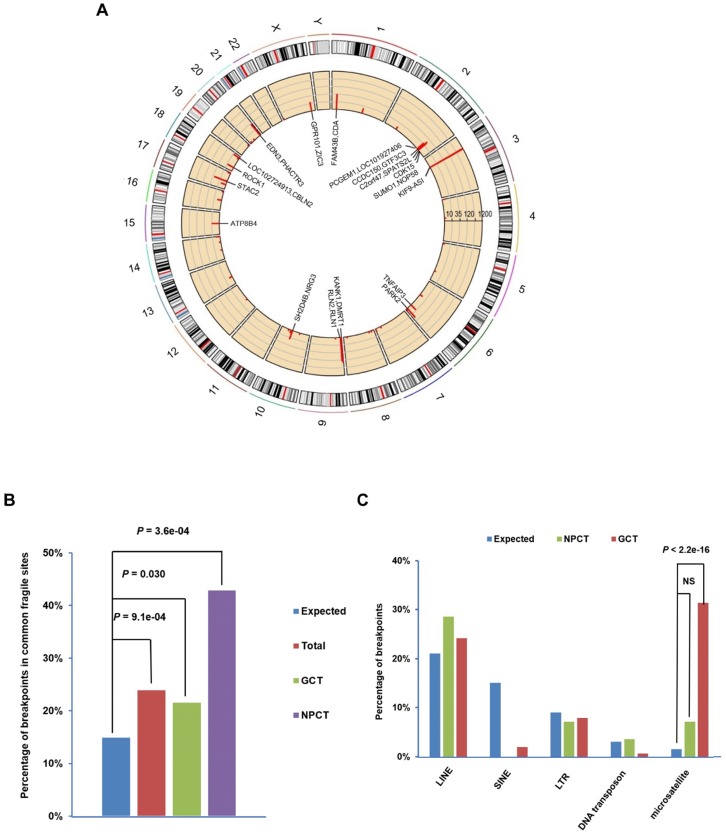
Figure 1.
Distribution of EBV integration breakpoints. (A) Distribution of the 197 integration breakpoints across the human genome. For each integration breakpoint, each bar represents the total number of supporting reads at a specific locus in the human genome. Gene annotations for 23 breakpoints in 10 cancers and the C666.1 cell line supported by ≥ 9 EBV-DNA chimeric read pairs are labeled. (B) Distribution of 197 breakpoints in common fragile regions. The expected (assuming uniform and random distribution, blue) and observed ratios of EBV integration breakpoints detected in all samples (n=34, red, total), gastric carcinomas (n=10, green, GCT) and NPC (n=17, purple, NPCT) in common fragile regions are shown. P-values were calculated using the binomial exact test. (C) Significant enrichment of integration breakpoints with microsatellite repeats in gastric carcinomas. The expected and observed ratios of breakpoints co-localized with repeat elements LINE, SINE, LTR, DNA transposon and microsatellite in NPC (green, NPCT) and gastric carcinoma (red, GCT) are shown (for detailed frequencies, see Supplementary Figure. 3). P-values were calculated using the binomial exact test. NS, non-significant; LINE, long interspersed nuclear element; SINE, long interspersed nuclear element; LTR, long terminal repeat.

