Figure 4.
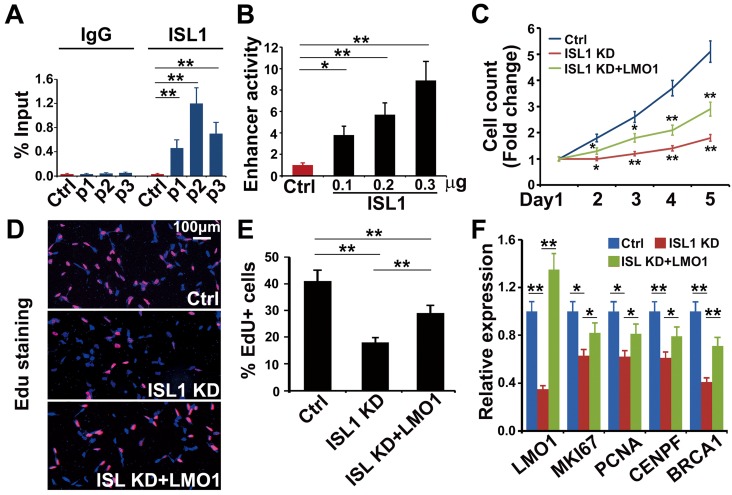
LMO1 is a direct downstream target of ISL1 in neuroblastoma. (A) ChIP-qPCR showing binding of ISL1 at P1, P2 and P3 enhancer regions of LMO1. Error bars represent ±SD; n=3, **p<0.01, 2-tailed t-test. (B) Luciferase assay showing LMO1 superenhancer activity in the presence of ISL1. Error bars represent ±SD; n=3, **p<0.01, 2-tailed t-test. (C) Re-expression of LMO1 partially restores cell growth of ISL1 KD neuroblastoma cells. Error bars represent ±SD, n=6, *p<0.05; **p<0.01; 2-tailed t-test). (D) EdU staining showing re-expression of LMO1 partially restores proliferation of ISL1 KD neuroblastoma cells. (E) Quantification of EdU-positive cells. Error bars represent ±SD, n=5, *p<0.05; **p<0.01. (G) qPCR showing restored proliferation gene expression. Error bars represent ±SD, n=3, *p<0.05; **p<0.01, 2-tailed t-test).

