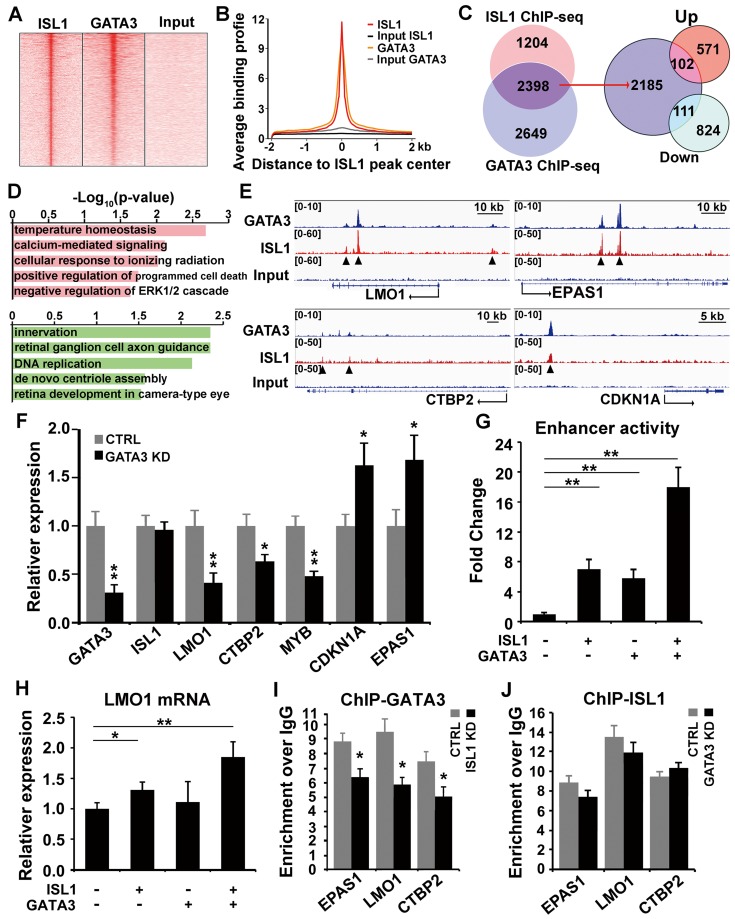
Figure 5.
ISL1 and Gata3 synergistically activate downstream genes in neuroblastoma. (A. B) Heatmap (A) and aggregation plot (B) of ChIP-Seq mapped reads of Gata3 and ISL1 at all ISL1 binding sites. (C) Overlay of ISL1 ChIP-seq and GATA3 ChIP-seq datasets in SH-SY5Y (left). Overlay of the common target genes of ISL1 and GATA3 with genes differentially expressed in ISL1 KD neuroblastoma cells. (right). (D) GO terms enriched in common direct targets of ISL1 and GATA3 upregulated or downregulated in ISL1 KD neuroblastoma (top 5 not redundant categories are shown). (E) Integrative Genomics Viewer (IGV) showing ChIP-seq tracks for ISL1 and GATA3 at the loci of representative common target genes in neuroblastoma (arrowhead showing binding peaks). (F) qPCR analysis of GATA3 KD SH-SY5Y cells, showing similar alterations in expression of selected ISL1 target genes, noting that ISL1 expression is not altered. Error bars represent ±SD, n=3, *p<0.05; **p<0.01, 2-tailed t-test. (G) LMO1 enhancer Luciferase analysis in the presence of ISL1 and/or GATA3. Error bars represent ±SD, n=3, **p<0.01, 2-tailed t-test). (H) LMO1 mRNA expression in 293T cells transfected with ISL1 and/or GATA3. Error bars represent ±SD; n=3; *p<0.05, **p<0.01, 2-tailed t-test. (I, J) GATA3 ChIP-qPCR analysis of ISL1 KD neuroblastoma cells (I) and ISL1 ChIP-qPCR of GATA3 KD neuroblastoma cells (J) on selected common targets of ISL1 and GATA3. Error bars represent ±SD; n=3; *p<0.05, **p<0.01, 2-tailed t-test.

