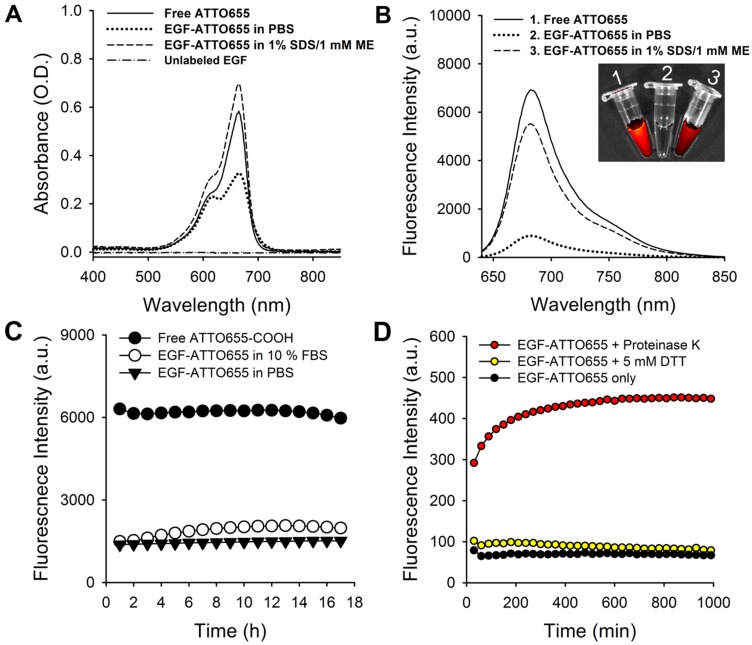
Figure 2.
Characterization of EGF-ATTO655. (A) Absorption and (B) fluorescence spectra (λex 600 nm) of free ATTO655, EGF-ATTO655 in PBS, and EGF-ATTO655 in PBS containing 1% SDS + 1 mM ME at the concentration of 5 μM dye equiv., respectively. The absorption spectrum of unlabeled EGF is shown for comparison. Inset images: merged images of the bright-field and fluorescence (λex 620/20 nm, λem 670/40 nm) of the sample tubes containing 1) free ATTO655-COOH, 2) EGF-ATTO655 in PBS, and 3) EGF-ATTO655 in PBS containing 1% SDS + 1 mM ME. (C) Stability of quenched state of free dye and EGF-ATTO655 in PBS and PBS containing 10% FBS. Fluorescence intensities of the sample solutions (λex 600 nm, λem 684 nm) were measured for 18 h. (D) Fluorescence turn-on of EGF-ATTO655 upon enzyme treatment. EGF-ATTO655 was reacted with 20 μg/mL proteinase K or 5 mM DTT, and then changes in its fluorescence intensities were measured every 30 min for 18 h.

