Figure 5.
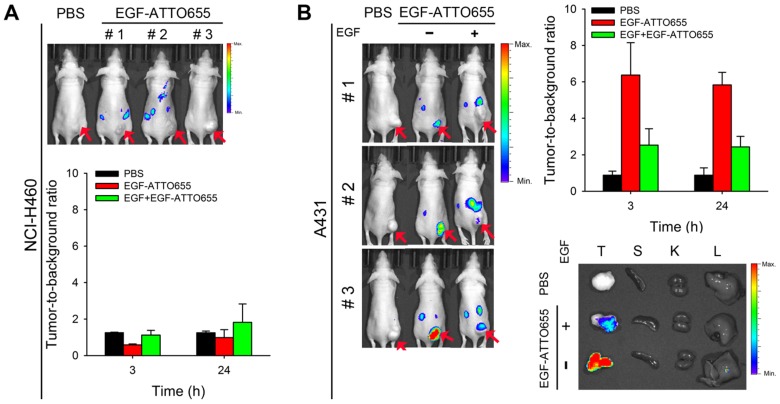
In vivo NIR fluorescence imaging of EGFR-positive tumors. (A) NIR fluorescence images of the mice bearing EGFR-negative NCI-H460 tumors at 3 h post-injection of EGF-ATTO655 (upper panel), and analysis of tumor-to-background ratio (TBR) at different time points (lower. (B) NIR fluorescence images of the mice bearing EGFR-positive A431 tumors at 3 h post-injection of EGF-ATTO655 (left panel), and analysis of tumor-to-background ratio (TBR) at different time points (right panel). Results from ex vivo imaging of the tumor and organs (T: tumor, S: spleen, K: kidney, L: liver) are also shown. The tumor-bearing mice with (+ EGF) and without (- EGF) co-treatment of excess unlabeled EGF are compared. Arrows indicate tumor sites.

