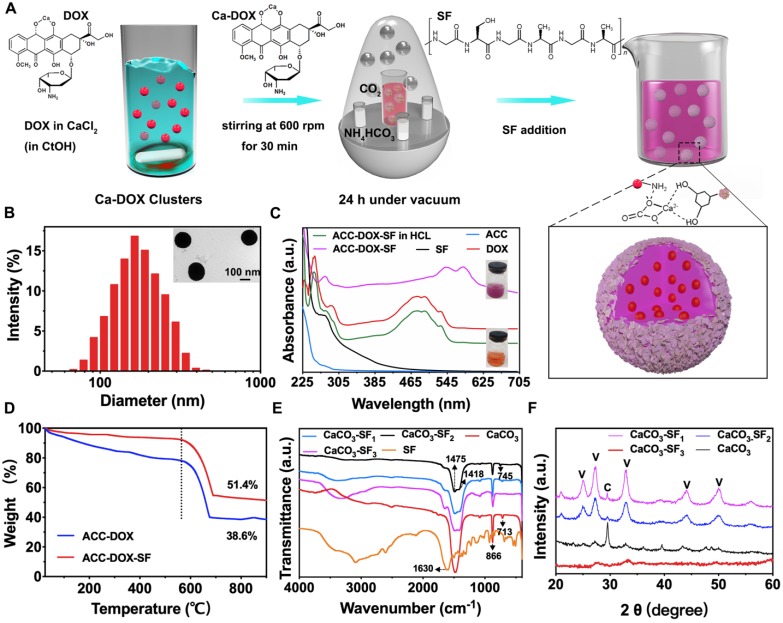
Figure 2.
Characterization of ACC-DOX-SF NPs. (A) The fabrication process of ACC-DOX-SF NPs. (B) Hydrodynamic size distribution and representative TEM image (inset) of ACC-DOX-SF NPs. (C) UV-Vis spectra of a solution of ACC-DOX-SF NPs in dilute HCl (ACC-DOX-SF NPs in HCl); pure ACC; and solutions of ACC-DOX-SF NPs, pure DOX and pure SF in deionized water. The upper inset image is a purple suspension of ACC-DOX-SF NPs in deionized water. The lower inset image is an orange suspension of ACC-DOX-SF NPs in dilute HCl. (D) TG curves of the ACC-DOX-SF NPs and ACC-DOX NPs. (E, F) FTIR spectra and XRD patterns of SF, CaCO3 NPs (without the addition of SF), CaCO3-SF1 NPs (the concentration of SF was 1.5 mg/mL), CaCO3-SF2 NPs (the concentration of SF was 2.5 mg/mL) and CaCO3-SF3 NPs (the concentration of SF was 3.5 mg/mL).

