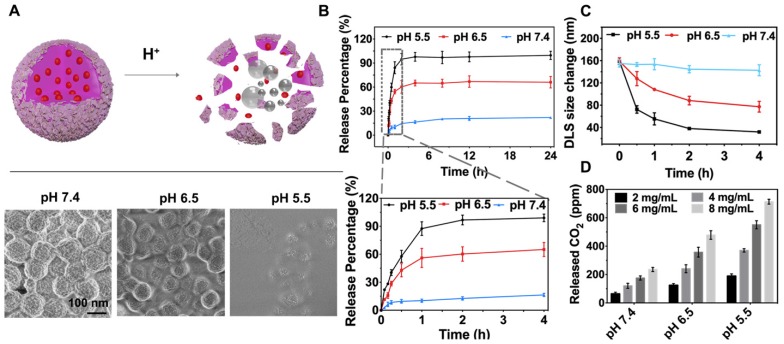
Figure 3.
In vitro pH-responsive DOX release. (A) Schematic illustration of the acid-responsive decomposition of ACC-DOX-SF NPs and their corresponding FESEM images after incubation in PBS at different pH values (5.5, 6.5 and 7.4) for 2 h. (B) pH-responsive drug release curves of DOX from ACC-DOX-SF NPs. The lower picture is a magnification of the DOX release profile within 4 h. (C) Time-dependent changes in the size of NPs suspended in different pH values. (D) Quantitative CO2-generation profiles of the ACC-DOX-SF NPs at different concentrations and incubated in acetate buffer solution with different pH values. The results are expressed as the mean ± standard deviation (SD), *P < 0.05, **P < 0.01, or ***P < 0.001.

