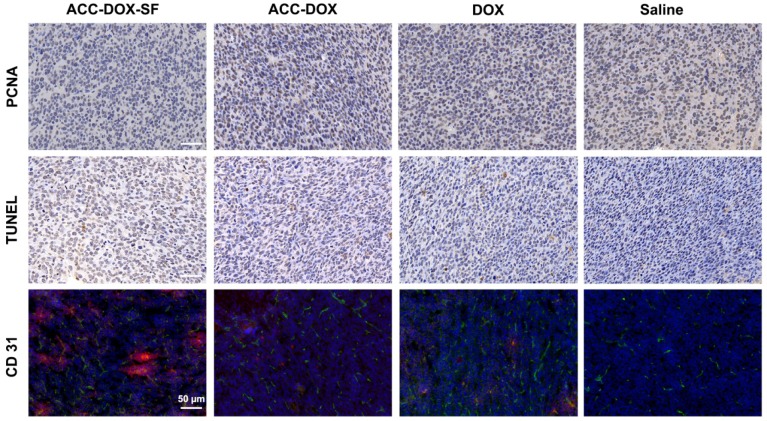
Figure 7.
Immunochemical staining of PCNA and TUNEL and CD31-FITC staining of tumor sections from 4T1 tumor-bearing mice after different treatments. For CD31 images of tumor section, the nuclei were stained by DAPI (blue), CD31 was labeled with FITC (green) and DOX presented as red. The scale bars are 50 µm.

