Figure 9.
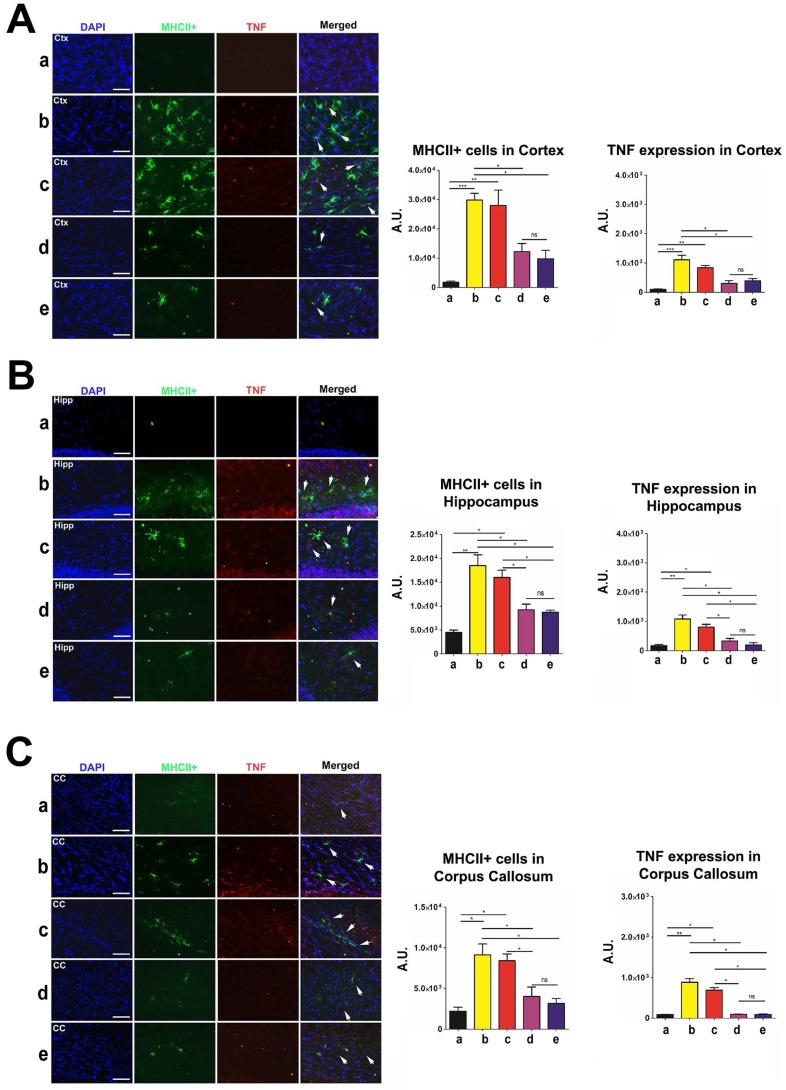
Labeling to determine major histocompatibility complex class II (MHCII) and tumor necrosis factor (TNF) levels in the brain at 90 days post-TBI. Treatment with moderate and high doses of stem cells appeared to modulate the exacerbated inflammatory response and downregulate MHCII and TNF expressions in the brain 90 days post-TBI. Results were analyzed using one-way ANOVA for each time point (*p<0.05; **p<0.01; ***p<0.001; ns p>0.05). Arrow heads indicate colocalization of MHCII- and TNF-positive cells. n = 12 animals for each group. Scale bar = 50 µm. a: Sham-Control; b: TBI-Vehicle; c: TBI-Low dose; d: TBI-Moderate dose; e: TBI-High dose; A.U.: average labeling intensity in arbitrary units; Ctx: cortex; Hipp: hippocampus; CC: corpus callosum. (A) MHCII and TNF immunofluorescence images and quantitative analysis of labeling intensity in the cortex. Statistical analysis for MHCII labeling intensity: ANOVA revealed significant treatment effects (F(4,15)=15.18, p<0.0001, Bonferonni's test p<0.05). Statistical analysis for TNF labeling intensity: ANOVA revealed significant treatment effects (F(4,15)=19.34, p<0.0001, Bonferonni's test p<0.05). (B) MHCII and TNF immunofluorescence images and quantitative analysis of labeling intensity in the hippocampus. Statistical analysis for MHCII labeling intensity: ANOVA revealed significant treatment effects (F(4,15)=17.74, p<0.0001, Bonferonni's test p<0.05). Statistical analysis for TNF labeling intensity: ANOVA revealed significant treatment effects (F(4,15)=19.89, p<0.0001, Bonferonni's test p<0.05). (C) MHCII and TNF immunofluorescence images and quantitative analysis of labeling intensity in the corpus callosum. Statistical analysis for MHCII labeling intensity: ANOVA revealed significant treatment effects (F(4,15)=11.11, p<0.0001, Bonferonni's test p<0.05). Statistical analysis for TNF labeling intensity: ANOVA revealed significant treatment effects (F(4,15)=60.94, p<0.0001, Bonferonni's test p<0.05).

