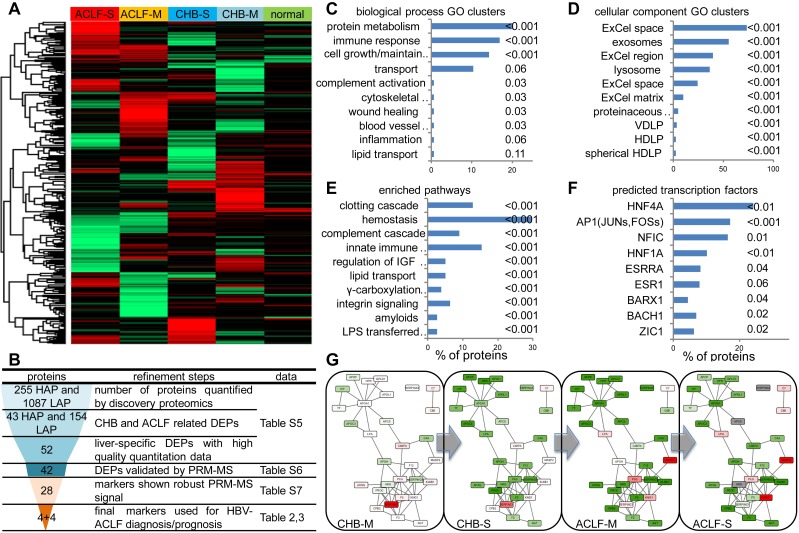
Figure 2.
Summary of high-throughput proteomics analysis of CHB and ACLF in the discovery study. (A) Heatmap representation of abundance profile of all proteins in 5 groups. The 2MEGA quantitation data in Log2 scale were transformed into Z-score by rows. The rows were clustered using the K-mean algorithm. (B) Steps in refining the biomarker candidates down to multi-protein classifier panels. HAP: high abundant protein; LAP: low abundant protein; MVDA: multivariate data analyses. Summary of functional annotation of ACLF by GO biological processes (C), cellular components (D), pathways (E) and predicted TFs (F) related to the ACLF-associated differentially expressed proteins (DEPs). Length of bars represent percentage of DEPs associated with each term. Significance of enrichment (p-value) was noted next to the bar for each term. HDLP, high-density lipoprotein particle; VDLP: Very-low-density lipoprotein particle; ExCel, Extracellular; LPS, Lipopolysaccharide; LBP, Lipopolysaccharide binding protein. Molecular interaction maps between DEPs were annotated by STRING database (G). Color shades (red for upregulation, green for downregulation, colorless for insignificant changes, grey for data not available) represent expression ratio compared with normal condition from all DEPs pooled from LAP and HAP fractions. For protein presented in both HAP and LAP fractions, expression level from HAP was used as final input for network visualization.

