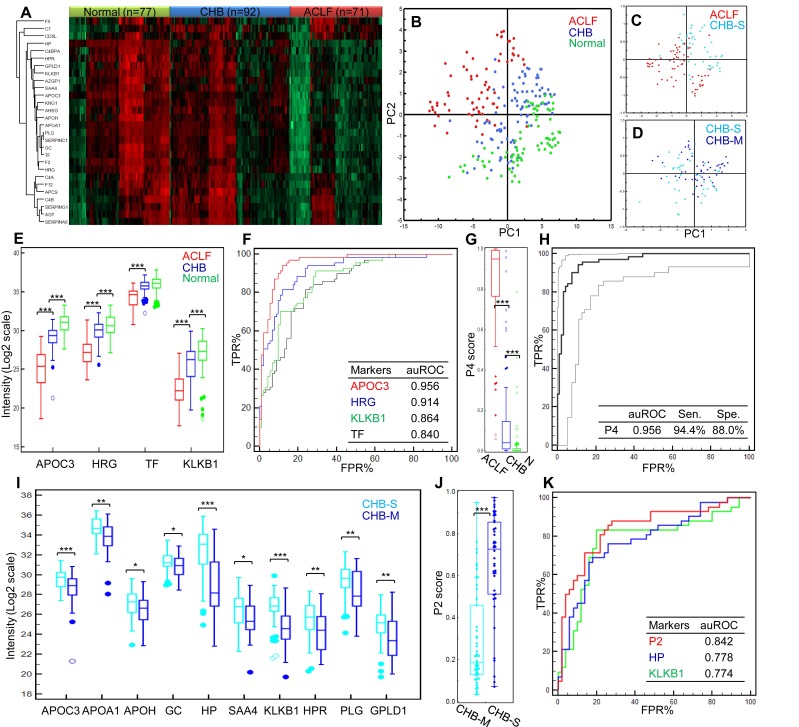
Figure 3.
Summary of targeted proteomics analysis of CHB and ACLF in the validation study. (A) Heatmap representation of overall abundance profile of all 28 robustly detected proteins in 3 groups. The protein quantitation data in Log2 scale were transformed into Z-score by rows. The rows were clustered using the K-mean algorithm. To highlight the intergroup differences, samples (columns) were clustered within each group first before making the heatmap. (B) PCA score plot of all samples showing clear separation of ACLF from other groups. (C) PCA plot showed clear separation of ACLF and preclinical severe-CHB (ACLF vs. CHB-S) samples. (D) PCA plot showed no clear separation of mild- and severe-CHB (CHB-M vs. CHB-S) samples. Relative quantities of 4 proteins (E) and the P4 score (G) between HBV-ACLF (red), CHB (blue) and healthy controls (green) were shown. ROC analyses of all 4 diagnostic markers (F) and the P4 diagnostic score (H) to differentiate HBV-ACLF from CHB patients in the validation sample set. Dash lines represent 95% confidence intervals. We also found ten proteins shown decreasing level in CHB-S as compared to CHB-M (I). HP and KLKB1 both showed high diagnostic value (auROC > 0.75) to differentiate CHB-M and CHB-S, the logistic model built based on HP and KLKB1 showed significant difference between two CHB groups (J) and achieved auROC of 0.84 (K). Note: *,**,*** represent p-value <0.05, <0.01, <0.001, respectively. NS: non-significant.

