Figure 4.
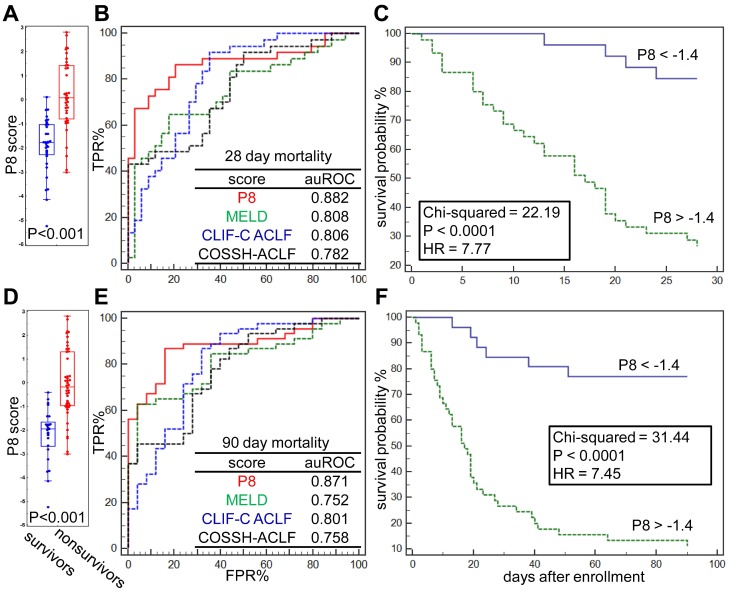
Prognostic performance of the P8 score. (A) Difference of Prognostic P8 between survivors and nonsurvivors at 28 days post admission. (B) Comparison of Prognostic P8, MELD, CLIF-C ACLF and COSSH-ACLF score in prediction of 28-day endpoint event by ROC plots. ROC characteristics of 4 scores were summarized in the table. (C) Kaplan-Meier analysis shown the difference of 28-day survival probability in HBV-ACLF subgroups partitioned by Prognostic P8 score at its threshold derived via ROC analysis. The same analyses were also performed for 90-days survival (D, E, F).

