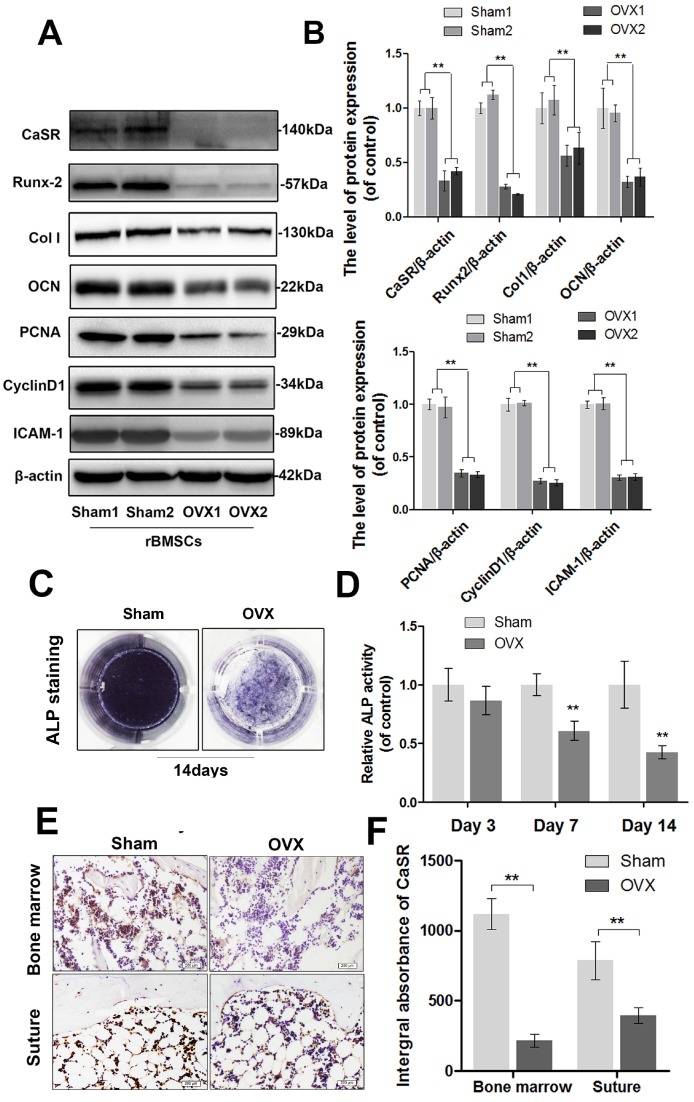
Figure 1.
Expression of CaSR and the osteogenic differentiation, proliferation, and adhesion capabilities of sham-rBMSCs and OVX-rBMSCs. (A) Representative western blot results of CaSR, Runx-2, collagen I, OCN, PCNA, cyclin D1, and ICAM-1 expression. (B) Quantification of western blot data shown in A. (C) Representative images of ALP staining of sham-rBMSCs and OVX-rBMSCs at day 14. (D) Quantitative analysis of ALP expression at days 3, 7, and 14. (E) Immunohistochemical staining of CaSR expression in the bone marrow and calvarial suture (original magnification 100×, scale bar: 200 μm). (F) Quantitative analysis of E. Data are presented as the mean ± S.D. Significant differences between the sham and OVX groups are indicated as ** P < 0.01, * P < 0.05, n = 5.

