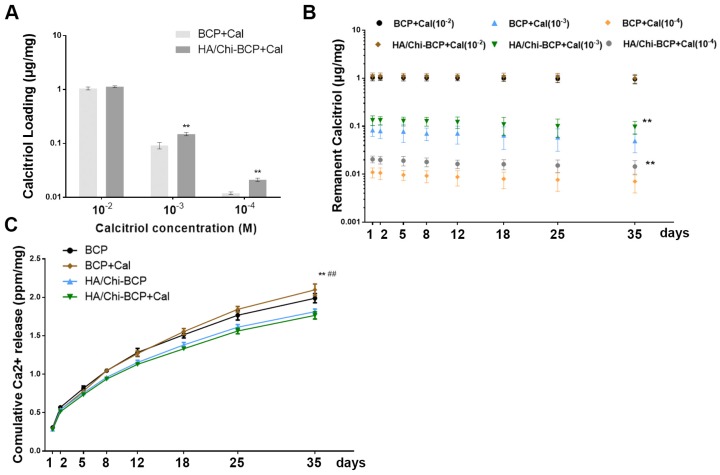
Figure 4.
Drug loading and retention ability and ions releasing profile. (A) Cal loading amounts in BCP and HA/Chi-BCP were quantified through UPLC. (B) UPLC results of the retained amounts of Cal in BCP and HA/Chi-BCP loaded with drug concentrations of 10-2, 10-3, and 10-4 M at 1, 2, 5, 8, 12, 18, 25, and 35 days. (C) ICP-MS results of the cumulative release of calcium ions from various scaffolds. Data are presented as the mean ± S.D. Significant differences between the HA/Chi-BCP and bare BCP are indicated as ** P < 0.01; differences between the HA/Chi-BCP+Cal and BCP+Cal groups are indicated as ## P < 0.01; all n = 5.

